- Hermetica
- Posts
- Weekly Update - September 12, 2025
Weekly Update - September 12, 2025
Stay Long BTC, Earn Yield

IN THIS ISSUE
🪙 Stay Long BTC, Earn Yield
🗞️ Artemis Stablecoin Update
💰 USDh Yield Recap
☎️ Hermetica Hangout
📈 Weekly Market Review
Like what you see? Follow us on X so you don’t miss any future announcements:
Stay Long BTC, Earn Yield

Stacks announced the removal of the sBTC deposit cap on September 16, alongside lowering the minimum deposit size from 0.01 BTC to 0.001 BTC.
The change makes the USDh/sBTC borrow loop on Zest more accessible:
🔸 Supply sBTC to earn 3% APY
🔸 Borrow USDh against sBTC at 5% borrow APR
🔸 Stake USDh to earn up to 9% yield
Stay long BTC while earning yield.
Artemis Stablecoin Update
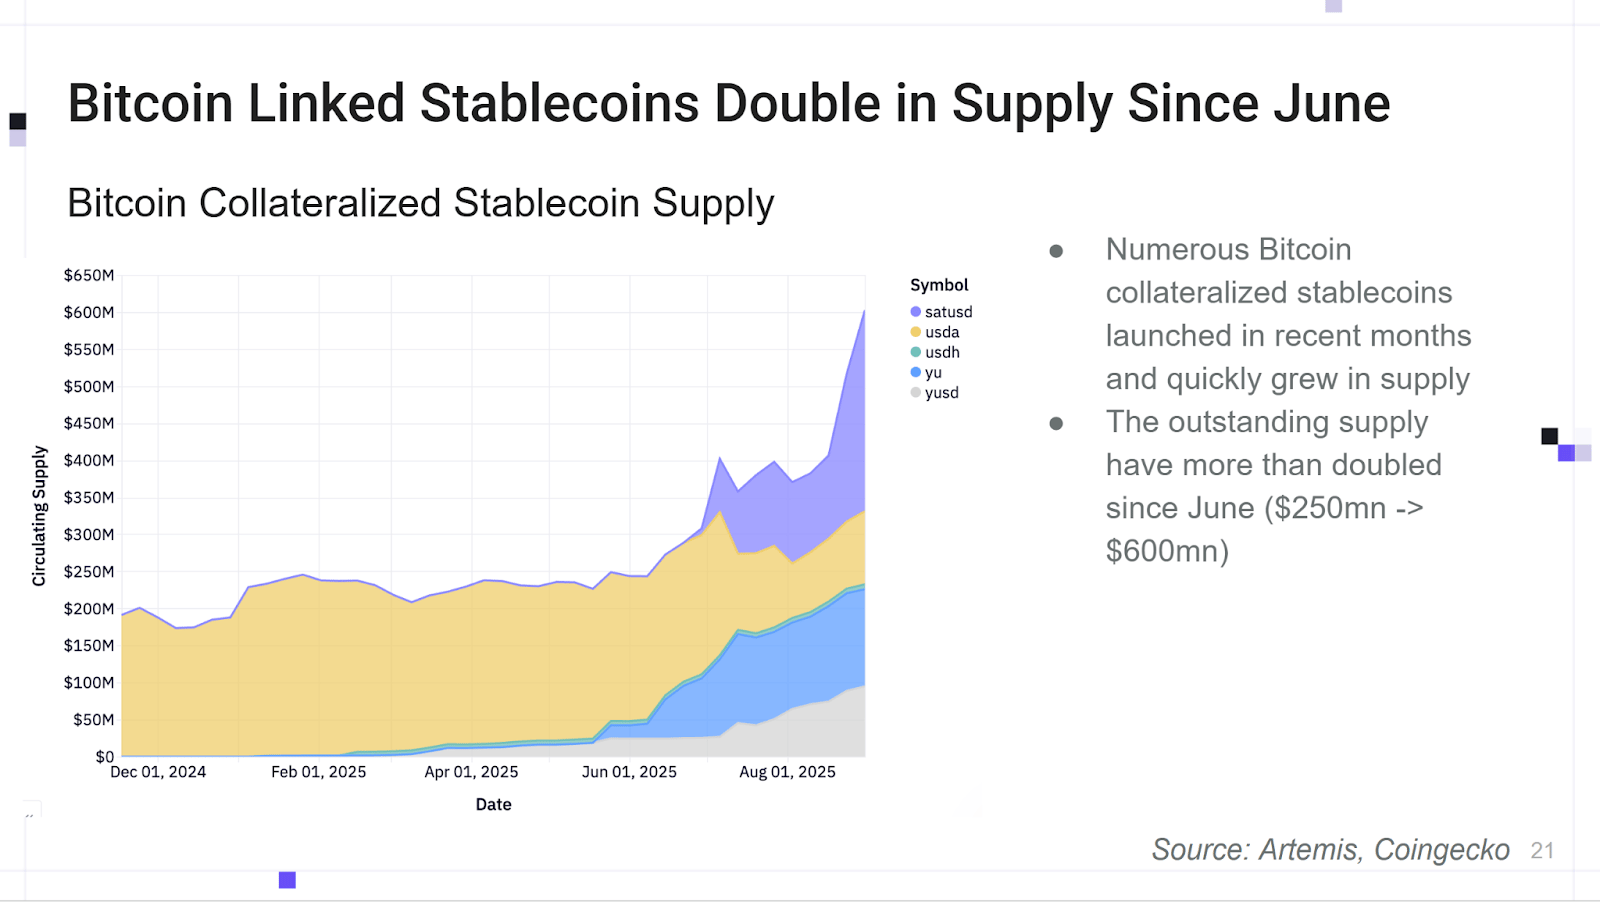
Artemis reports that stablecoins collateralized by Bitcoin have doubled in outstanding supply since June, climbing from $250M to $600M.
USDh grew by 24.7% during the same period, catering to the growing demand and adoption of Bitcoin-collateralized stablecoins.
USDh stands out as the first Bitcoin-backed, yield-bearing stablecoin powering a global economy on Bitcoin.
USDh Yield Recap
APY stands for Always Printing Yields.
This week, USDh lived up to it with 9% APY on Bitcoin-backed dollars.
Hermetica Hangout

The spotlight this week was on conversations happening across the BTCfi ecosystem. We joined streams and X Spaces to talk about USDh, Stablecoins, and BTCfi.
Next week, we’ll be back with another session spotlighting builders pushing Bitcoin finance forward. Set your reminder, you won’t want to miss it.
Market Review
Bitcoin activity was muted this week, even as equities and some altcoins soared to all-time highs. Bitcoin holds a range between $120,000 and $110,000, the previous range high.
Aggregated altcoin market caps rose week-over-week from $1.56T to $1.66T. Bitcoin dominance fell 0.82% week-over-week and is nearing a new local low. Bitcoin dominance gradually rallied for 3 years through June, and has only recently reversed this trend.
DVOL fell to range lows of 34
The average equal-weighted futures basis spread is up 2.66% APR to 8.96% APR
The futures curve continues to steepen
Perpetual futures funding rates stayed positive in double digits all week, peaking at 25% on Tuesday
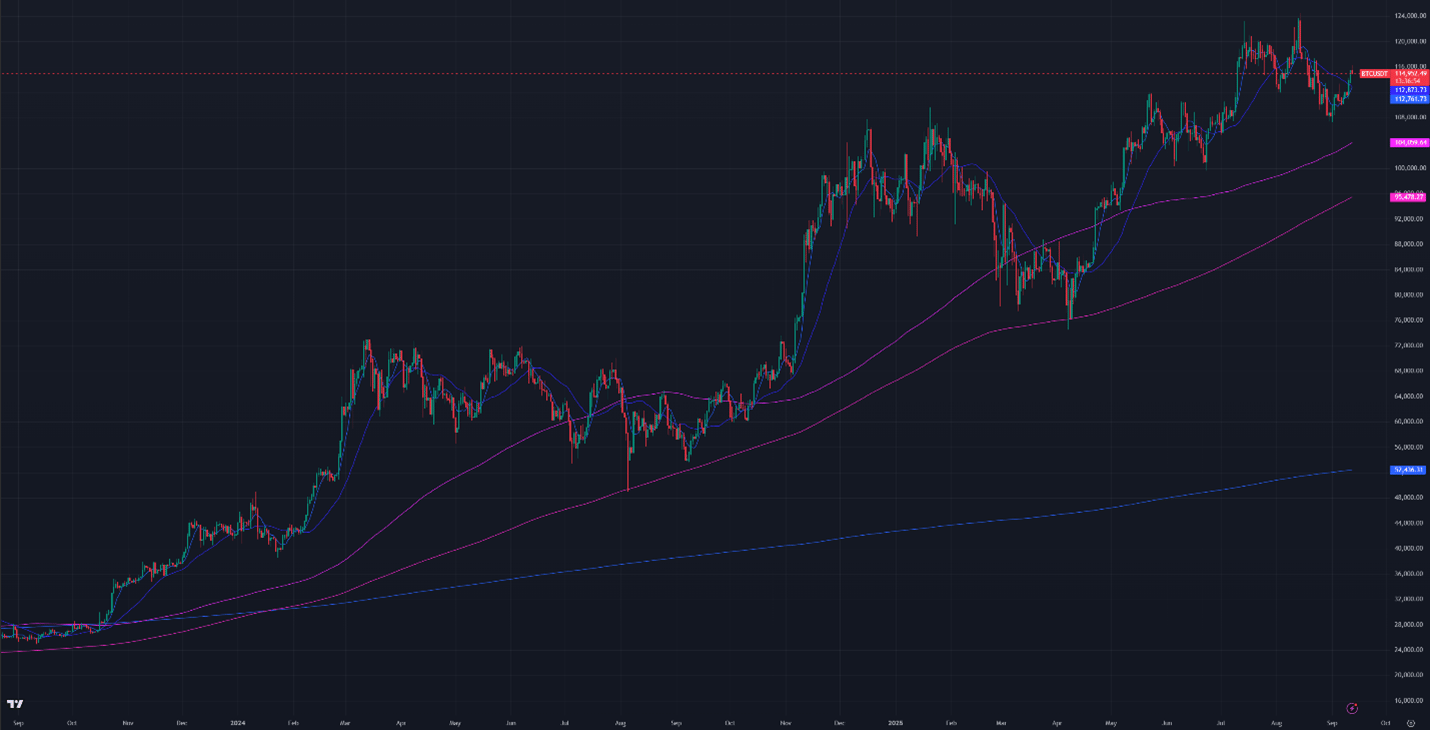
Figure 1: BTC Price, Daily Candles, & Moving Averages; 2 years; Source: Binance

Figure 2: Crypto Market Cap Excluding Bitcoin, Daily Candles, & Moving Averages; 2 years

Figure 3: Bitcoin Dominance, Daily Candles, & Moving Averages; 2 years
The moving averages (MA) in Figure 1 are:
Current Price: $115,000
7-Day MA: $112,800
30-Day MA: $112,900
180-Day MA: $104,100
360-Day MA: $95,500
200-Week MA: $52,400
Bitcoin is above both the 30-day and 7-day moving averages (MAs), signaling a weak uptrend.
Trend Following
Returns for a Bitcoin 7-day and 30-day long trend-following portfolio are down 5.6% from January’s ATH. The portfolio was long every day this week, recovering some of its earlier losses.
Current price action remains challenging for quantitative trend strategies. Low liquidity in Bitcoin has left it vulnerable to sharp rallies and sell-offs. Sharp price movements in illiquid markets can mislead quantitative trading systems by triggering buy or sell signals when the movements are actually random noise. In high-liquidity environments, random movements would remain below the threshold needed to trigger a signal.
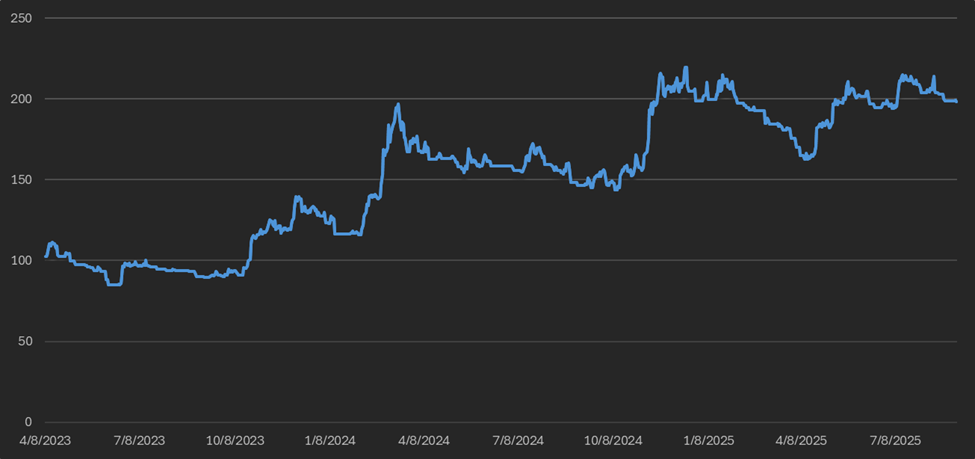
Figure 4: Bitcoin 7 & 30-day Trend Following Strategy Returns
BTC ETF Flows
Net inflows totaled $1.52B this week, up $1.24B from $284M last week. Ethereum ETFs saw $215M in outflows.

Figure 5: Bitcoin ETF Flows, Daily Bars; Source: The Block
Volatility
Bitcoin’s implied volatility (DVOL) has fallen to range lows of 34.45, levels not seen since the depths of the 2023 bear market. Low implied volatility typically signals weak demand in crypto markets. However, volatility is also in a long-term downtrend due to systematic market maker hedging in the Deribit options market. Both factors are contributing to the current low implied volatility.
TradFi Bitcoin products like ETFs and portfolio companies are increasingly selling call options for yield, creating systematic downward pressure on option prices and implied volatility. Yield Max’s $MSTY, for example, sells $4.5B in notional calls on Strategy (formerly MicroStrategy) stock monthly and quarterly. Hundreds of hedge funds do similar trades on miners and Bitcoin ETFs. Market makers buy these calls and resell on Deribit to lock in spreads, keeping DVOL capped even as recent price surges would normally trigger delta hedging.
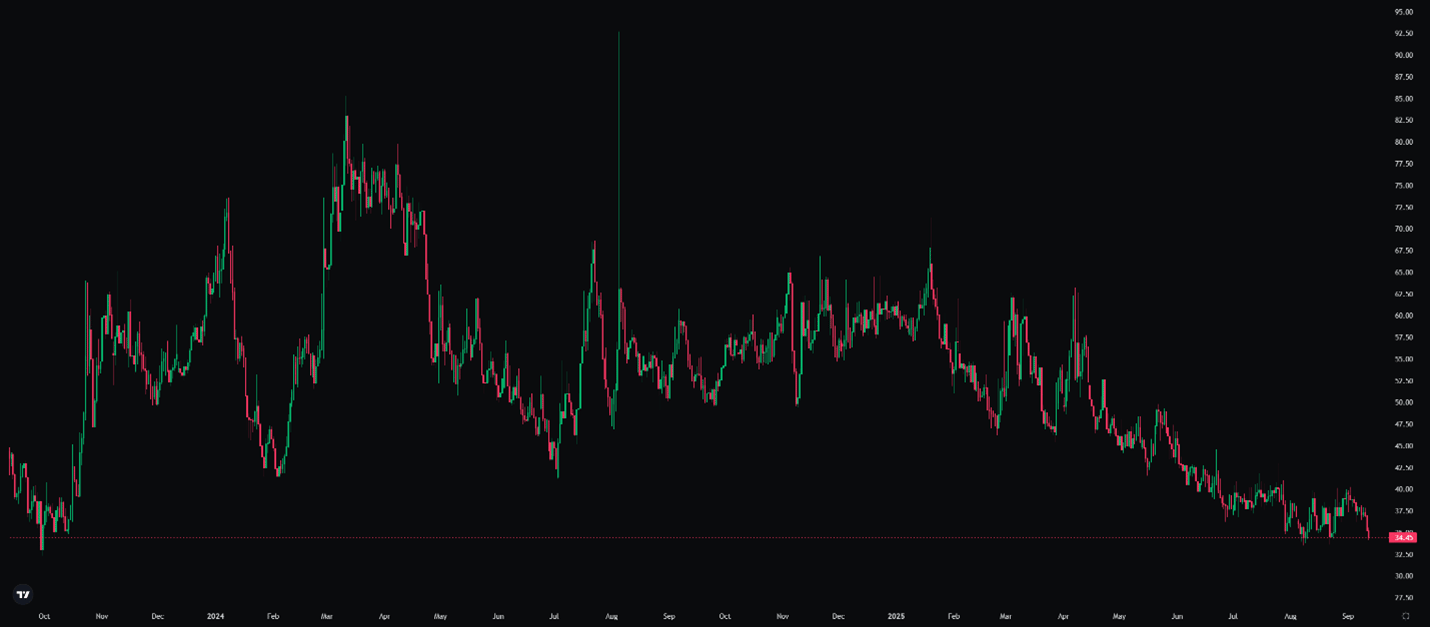
Figure 6: DVOL 2 Years; Bitcoin Index Price; Source: Deribit
Basis Spread
The basis spread, or the price of a futures contract over its spot price, is positive across all maturities. The average (equal-weighted) basis spread rose 2.66% APR, from 6.3% APR to 8.96% APR.
The futures curve is in a steepening inverted contango, with the front month trading above later maturities. There is a 2.67% spread between the lowest- and highest-yielding maturity. The curve has steepened gradually over the last month, rising from what was the flattest curve in the recent data set.
Deribit’s Bitcoin futures curve is indirectly suppressed by TradFi call selling, as it reduces market maker demand for delta hedges. Futures open interest is 33% lower than in December, despite the increase in spot price.
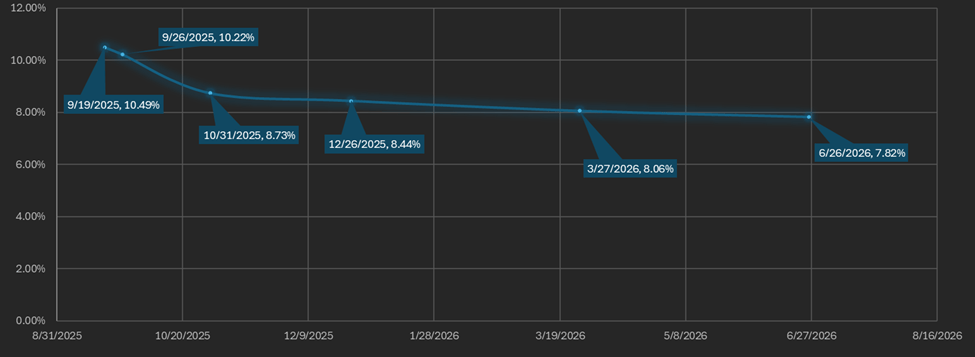
Figure 7: Futures Curve; Maturity Date, APR %
Macro
On August 22nd, Federal Reserve Chairman Jerome Powell announced major updates to the Fed’s monetary policy framework. These revisions occur every five years, with the last in August 2020.
The new framework returns to flexible inflation targeting with a balanced approach, meaning the Fed may cut rates even when employment is high.
The European Central Bank (ECB) cut rates by 25 bps on June 6th and has not cut since, despite greater clarity on its trade deal with the U.S. The Swiss National Bank cut rates by 25 bps to 0% in June, while the People’s Bank of China (PBOC) left rates unchanged. The Bank of England (BOE) cut rates by 25 bps on August 7th, and the Bank of Australia cut rates by 25 bps on August 12th. Britain and Australia remain the only major central banks to lower rates since June.
The Dollar Index ($DXY), which measures the U.S. dollar against a basket of other currencies, is 97.63 as of Thursday evening, near a three-year low. Rates declined this week, falling to 4.65% from last week's 4.86%. Despite the decrease, current rates are still higher than the 3.9% recorded a year ago. Labor force revisions and expectations of greater dovishness may have contributed to the decline in rates.
Both equity market implied volatility (VIX) and U.S. Treasury bond implied volatility (MOVE) are near their long-term steady states. The VIX has decreased to 14.69 from 15.22 last week, while the MOVE index is at a multi-year low of 75.07, a sharp drop from 88.26 last week.
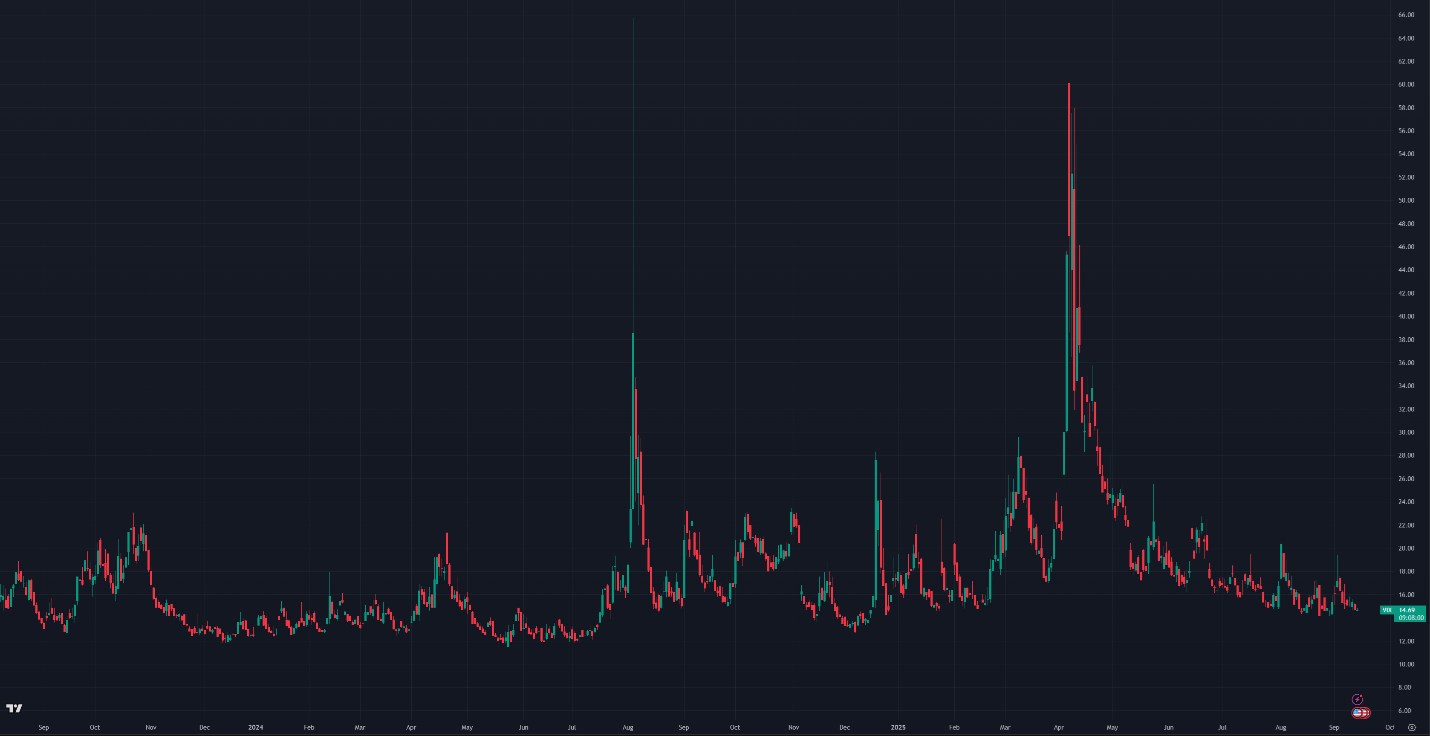
Figure 8: VIX, Daily Candles; 2 Years
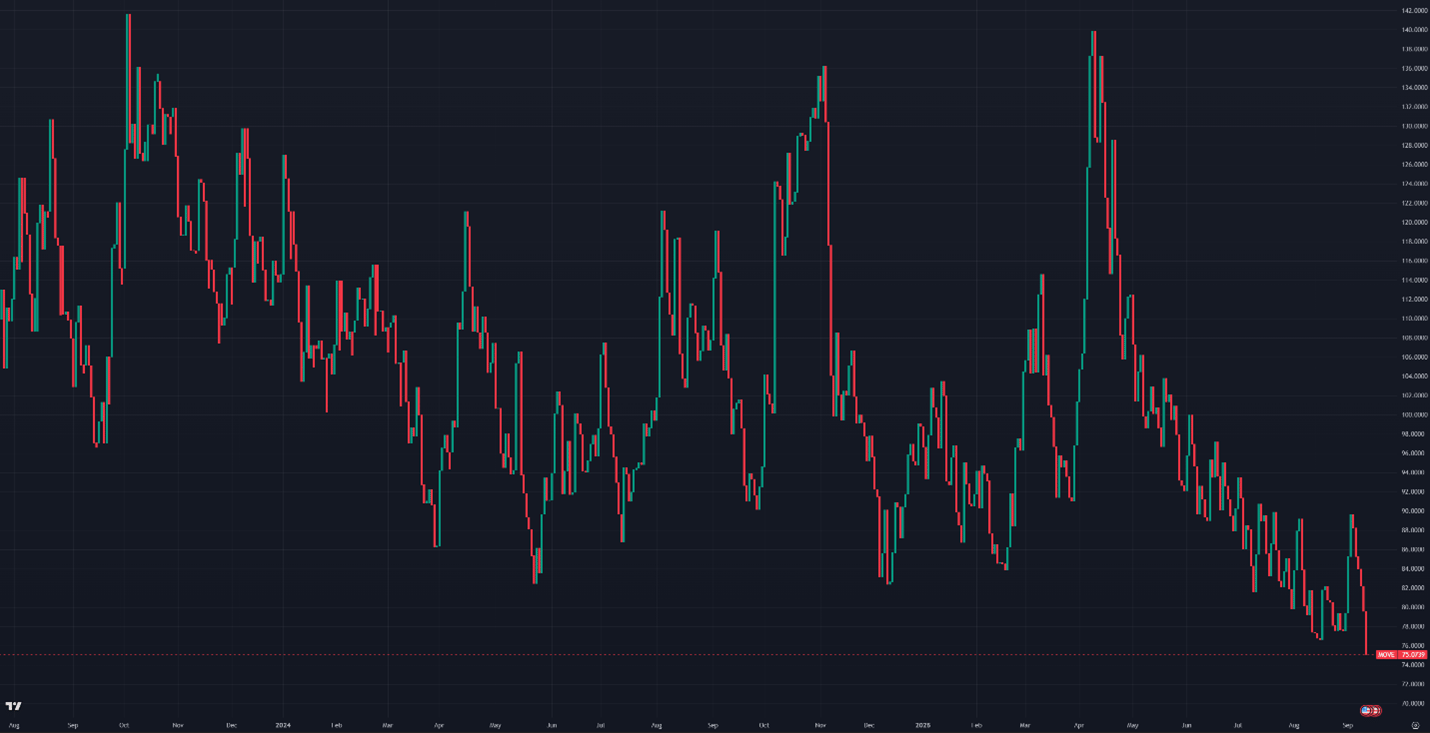
Figure 9: Move Index, Daily Candles; 2 Years
Sincerely,
The Hermetica Team