- Hermetica
- Posts
- Weekly Update - October 31, 2025
Weekly Update - October 31, 2025
Something Big is Coming
IN THIS ISSUE
🚨 Something Big is Coming
💸 Stacks Dual Stacking Live
🗞️ USDh Backing, Verified for October
💰 USDh Yield Recap
☎️ Hermetica Hangout
📈 Weekly Market Review
Something Big Is Coming
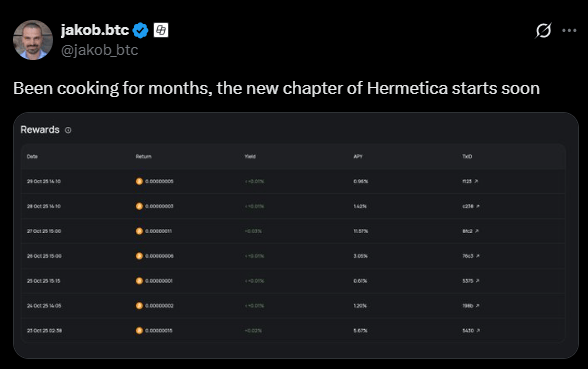
Jakob hinted at what’s next. A new chapter for Hermetica is coming soon.
Keep an eye on our socials next week as we answer the timeless question: why isn’t your Bitcoin earning?
Stacks Dual Stacking Live
Stacks Dual Stacking introduces a new tiered system for earning Bitcoin yield. Earn 0.5% base yield for holding sBTC.
Stack STX with your sBTC for up to 10x boosted rewards, or reach the highest multipliers by simply deploying sBTC into DeFi.
Get started with boosted yield:
🔸 Stack STX and sBTC
🔸 Borrow USDh against sBTC on Zest
🔸Stake USDh to earn boosted rewards on sBTC & USDh yields
USDh Backing, Verified for October

USDh’s October 2025 attestation is live.
USDh is fully backed by Bitcoin, held securely off-exchange with institutional-grade custodians Copper and Ceffu.
In summary, as of the snapshot time:
USDh supply: $5,052,745.50
Copper custodied assets: $2,579,233.70
Ceffu custodied assets: $2,142,986.17
Redeeming Reserve Stacks: $110,487.07
Redeeming Reserve Ethereum: $178,189.87
Minting Wallet: $36,704.97
Total backing assets: $5,052,953.70
Reserve Fund: $81,712.22
USDC: $75,148.12
USDh: $6,564.10
Total % of USDh: 101.49%
USDh Yield Recap
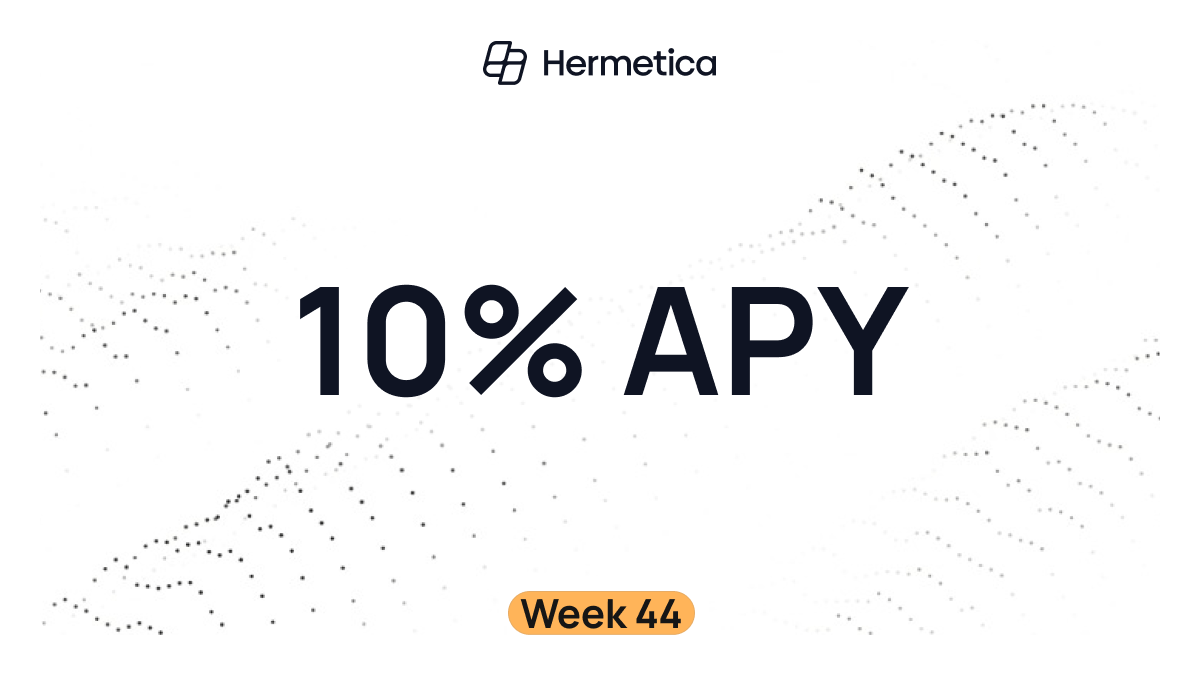
USDh paid 10% APY this week.
That’s a number your bank manager will never say out loud.
Hermetica Hangout
We’re hosting a special community Hangout next week. The afterparty to what’s coming.
Don’t miss out. Set your X reminder now.
Market Review
Bitcoin remains down more than 12% from all-time highs. The $116,000.00 level has been rejected twice since the crash on October 10. Bitcoin dominance increased 0.18%, its 4th week of gains placing it over 1% higher than pre-crash levels.
• DVOL: 43.94%
• Equal-weighted futures basis spread: 5.93% APR
• Futures curve flattened; front contracts increased
• Perp funding rates remain near zero
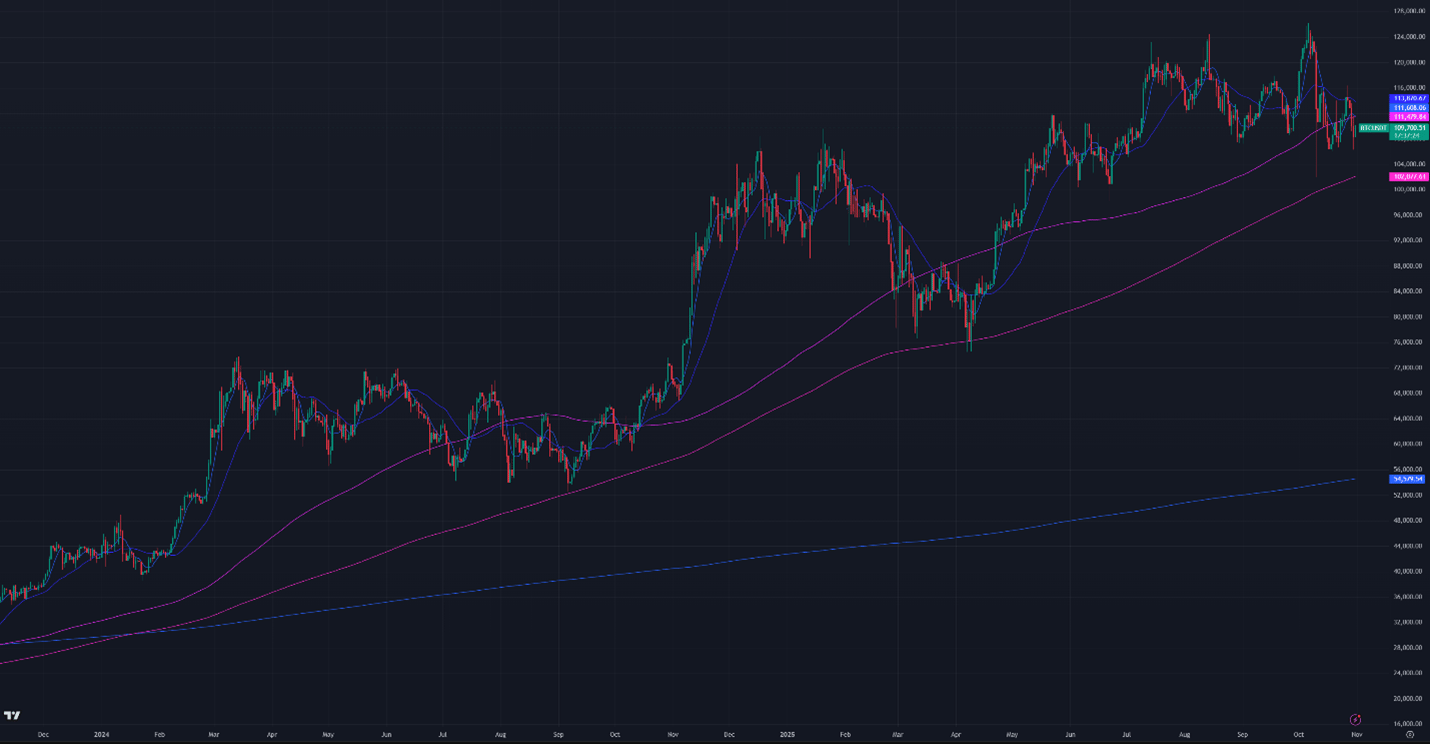
Figure 1: BTC Price, Daily Candles, & Moving Averages; 2 years; Source: Binance
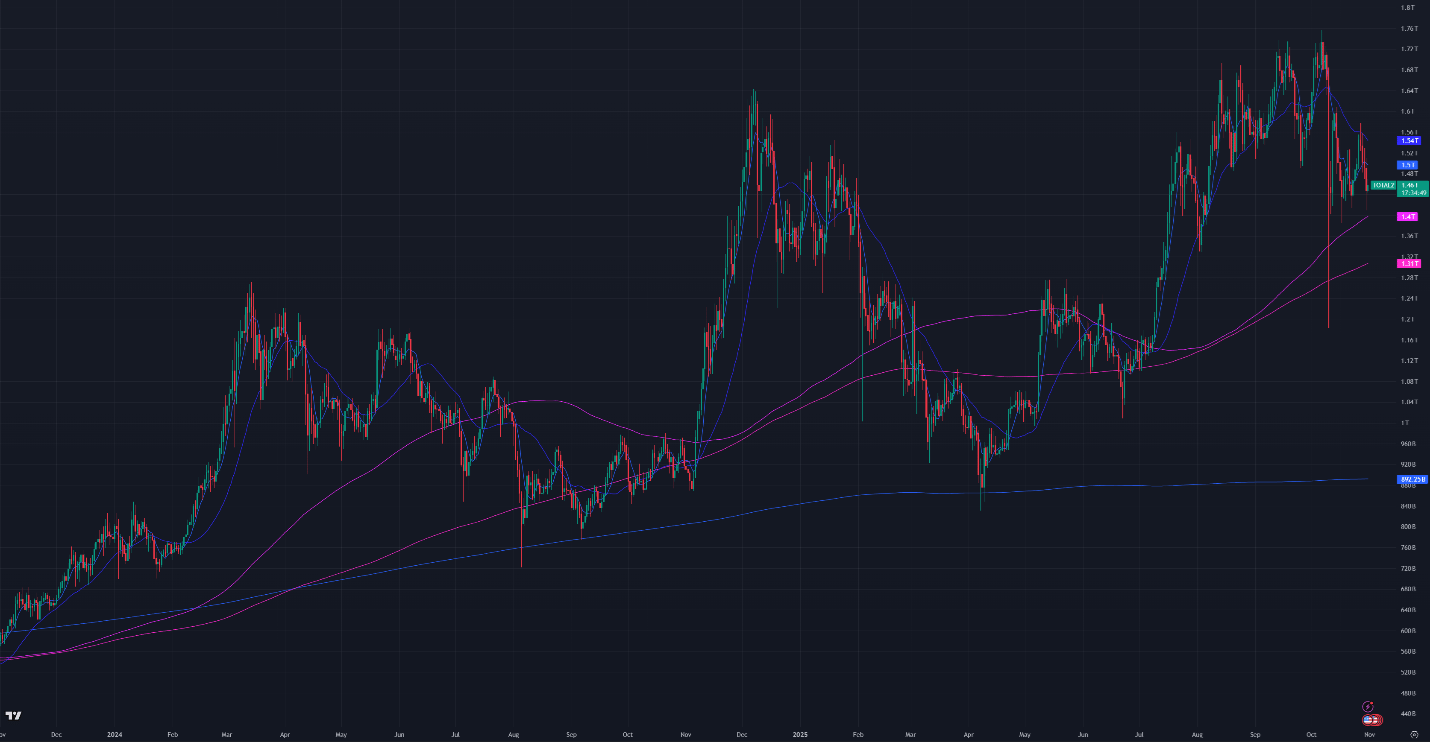
Figure 2: Crypto Market Cap Excluding Bitcoin, Daily Candles, & Moving Averages; 2 years

Figure 3: Bitcoin Dominance, Daily Candles, & Moving Averages; 2 years
The moving averages (MA) in Figure 1 are:
Current Price: $109,700
7-Day MA: $111,600
30-Day MA: $113,900
180-Day MA: $111,500
360-Day MA: $107,100
200-Week MA: $54,600
Bitcoin is below the 7-day, 30-day, and 180-day moving averages (MAs).
Trend Following
Returns for a Bitcoin 7-day and 30-day long trend-following portfolio are down 7.36% from January’s ATH. The portfolio experienced a downturn following the crash on October 10th and was subsequently turned off. Since then, it has reactivated four times, incurring minor losses each time.
Low liquidity leaves Bitcoin vulnerable to sharp sell-offs, as demonstrated late last week. Sharp price movements in illiquid markets can mislead quantitative trading systems by triggering buy or sell signals when the movements are random noise.
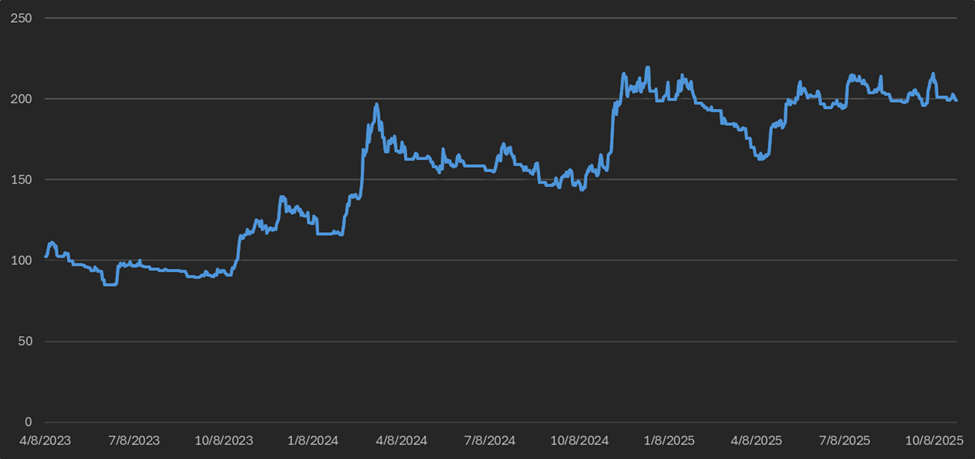
Figure 4: Bitcoin 7 & 30-day Trend Following Strategy Returns
BTC ETF Flows
Net outflows totaled $517M this week. Net ETF flows are negative, after being nearly flat last week with $11M in outflows.

Figure 5: Bitcoin ETF Flows, Daily Bars; Source: The Block
Volatility
Bitcoin’s implied volatility (DVOL) is elevated at 43.94% despite falling from the 50%+ range in the week following the October 10 crash. Implied volatility reached a two-year low in late September.
Volatility had been in a long-term downtrend, contributed to by market maker hedging. Hedging appears to have resumed as DVOL dropped from 50.7% to 43.49%in the second half of the week.
Market makers use the Deribit options book to hedge TradFi traders who sell calls on Bitcoin products such as ETFs, mining companies, and treasury-backed firms for yield. Yield Max’s $MSTY, for instance, sells $4.5B in notional calls on Strategy (formerly MicroStrategy) stock each month and quarter. Market makers buy these calls and resell similar ones on Deribit to lock in spreads, exerting systematic downward pressure on option prices and volatility. As volatility peaks, selling strangles and directional strategies is profitable.

Figure 6: DVOL 2 Years; Bitcoin Index Price; Source: Deribit
Basis Spread
The basis spread, or the price of a futures contract over its spot price, is positive across all maturities. The average (equal weighted) basis spread fell from 6.22% APR to 5.93% APR week-over-week.
The futures curve remains in normal contango, with the front month (November 28) trading below later maturities. The spread between the lowest- and highest-yielding contracts declined from 2.08% to 1.77%.
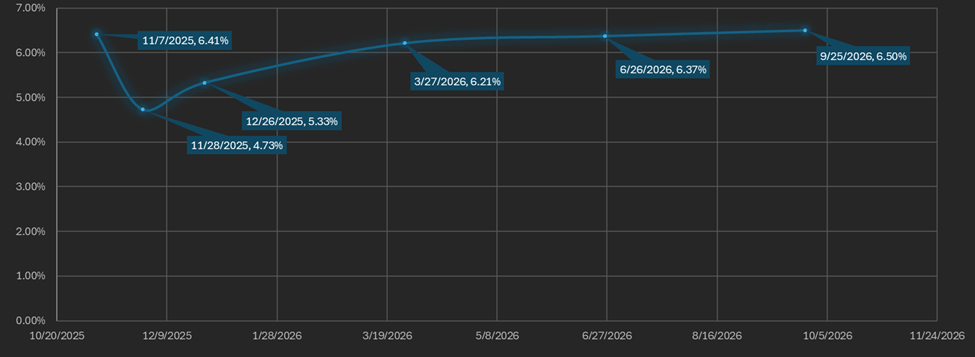
Figure 7: Futures Curve; Maturity Date, APR %
Macro
On October 30, the Fed held its 7th FOMC meeting of the year, where Chair Jerome Powell cut the federal funds rate by 25 bps and ended the Fed’s quantitative tightening (QT) program. QT had already slowed to $5B in monthly Treasury runoff, down from $25B per week last year.
Canada cut interest rates by 25 bps on October 29th. The European Central Bank (ECB), the Swiss National Bank, and the Bank of Australia also implemented rate cuts between July and August.
The Dollar Index ($DXY), which measures the U.S. dollar against a basket of other currencies, stands at 99.55 as of Thursday evening after bouncing from 3-year lows of 96.25 on September 17th. 30-year bond yields are slightly lower at 4.67%. Gold and silver prices reached record highs of $4,380.00 and $54.49 per ounce, respectively, on October 20th.
Both U.S. Treasury bond implied volatility (MOVE) and equity market implied volatility (VIX) remain near their long-term steady states. The VIX spiked 69% on October 17th but is now only slightly elevated above its long-term average. The VIX has since fallen from 17.29% to 16.14%, while the interest rate–adjusted MOVE index (MOVE Index / 10-Year Treasury Bond Yield) sits near 6-year lows at 16.28%.

Figure 8: VIX, Daily Candles; 2 Years

Figure 9: Move Index/US10Y, Daily Candles; 2 Years
Sincerely,
The Hermetica Team