- Hermetica
- Posts
- Weekly Update - October 24, 2025
Weekly Update - October 24, 2025
Grayscale Brings Stacks to Public Markets

IN THIS ISSUE
🏦 Grayscale Brings Stacks to Public Markets
🗞️ State of Crypto 2025
💰 USDh Yield Recap
☎️ Hermetica Hangout: Starknet
📈 Weekly Market Review
Grayscale Brings Stacks to Public Markets

Grayscale Stacks Trust is now trading on OTCQB, a U.S. over-the-counter market for publicly quoted securities.
The listing lets traditional investors buy the Stacks Trust (STXG) through standard brokerage accounts, without the challenge of buying or custodying directly on-chain.
State of Crypto 2025
Stablecoin volume reached $46T over the past year, rivaling Visa and ACH in transaction scale, according to a16z’s State of Crypto 2025 report.
More than 1% of all U.S dollars now exist as tokenized stablecoins on public blockchains.
Other highlights of 2025:
🔸 Total crypto market cap crossed $4T
🔸 Blockchain throughput exceeds 3,000 TPS, up 100x in five years
🔸 Total market for tokenized RWAs sits at $30B, up nearly 4x in two years
USDh Yield Recap

USDh stayed stable through the volatility, and still pulled a shiny 10% APY this week.
Did your wallet feel that? 👀
Hermetica Hangout: Starknet

This week, we hosted Starknet to learn about the trust-minimized BTC bridge infrastructure they’re building with Alpen Labs.
We’ll be back soon with another BTCfi builder. Set your X reminder now.
Market Review
The largest single liquidation event in crypto history occurred on October 10th. Spot Bitcoin prices collapsed 15% in less than seven hours. Altcoins saw even steeper losses, with order books for less liquid coins like Cosmos (ATOM) wiped out, briefly sending prices to zero.
While Bitcoin dominance rose 0.22% this week and aggregated altcoin market caps increased from $1.47T to $1.49T, the market remains severely weakened after the event.
• DVOL: 43.49%
• Average equal-weighted futures basis spread: 6.22% APR
• Futures curve flattened; front contracts increased
• Perp funding rates remain near zero
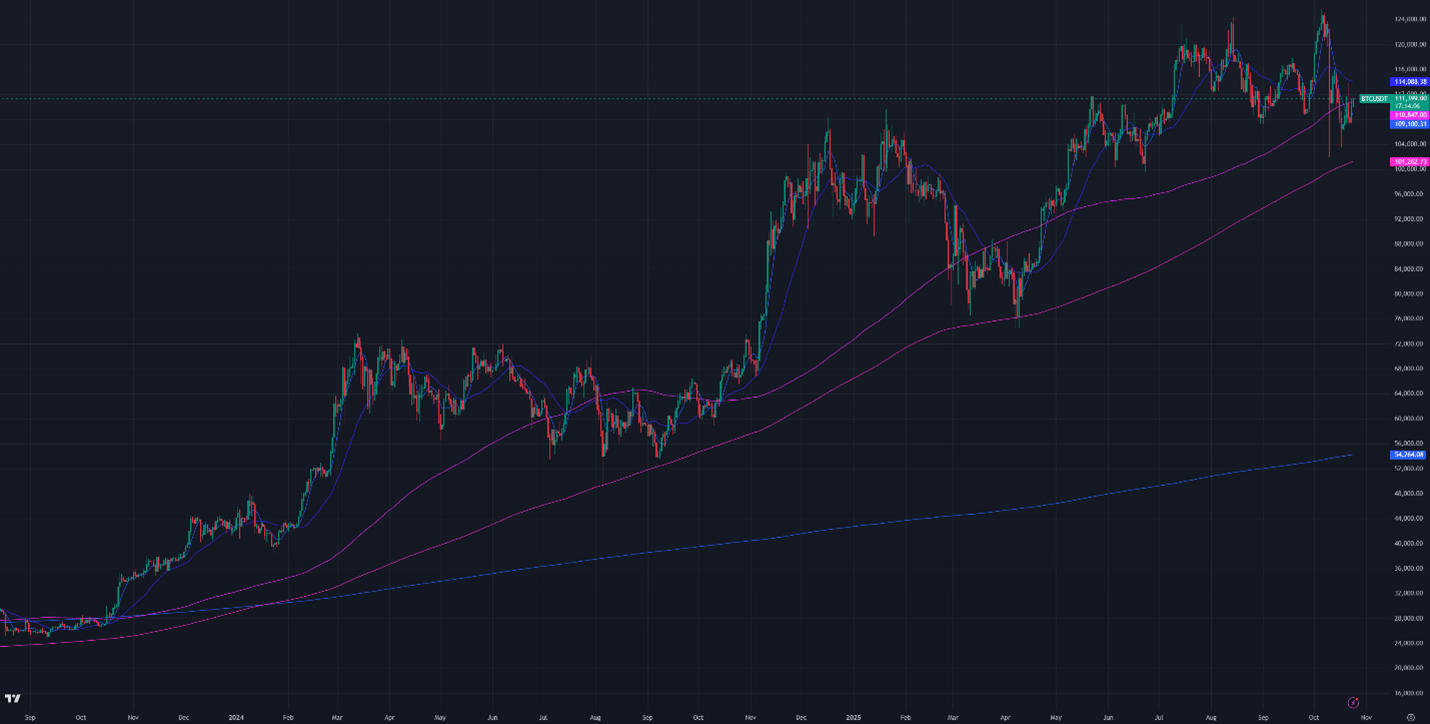
Figure 1: BTC Price, Daily Candles, & Moving Averages; 2 years; Source: Binance

Figure 2: Crypto Market Cap Excluding Bitcoin, Daily Candles, & Moving Averages; 2 years

Figure 3: Bitcoin Dominance, Daily Candles, & Moving Averages; 2 years
The moving averages (MA) in Figure 1 are:
Current Price: $111,400
7-Day MA: $109,110
30-Day MA: $114,100
180-Day MA: $110,900
360-Day MA: $101,300
200-Week MA: $54,300
Bitcoin fell below its 7-day, 30-day, and 180-day MAs last week but has since regained the 7- and 180-day levels.
Trend Following
Returns for a Bitcoin 7-day and 30-day long trend following portfolio are down 7.23% from January’s ATH. The portfolio experienced a drop during the October 10th liqudation and was subsequently deactivated. It briefly reactivated on the morning of the 22nd, only to turn off again after incurring a small loss.

Figure 4: Bitcoin 7 & 30-day Trend Following Strategy Returns
BTC ETF Flows
Net outflows this week were $10.9M. ETF net flows were essentially flat this week, coming off a $863M outflow last week.

Figure 5: Bitcoin ETF Flows, Daily Bars; Source: The Block
Volatility
The continuing turmoil in crypto has kept Bitcoin’s implied volatility (DVOL) elevated at 43.49%, despite falling from the 50%+ range maintained for most of the past two weeks. Implied volatility had reached a two-year low as recently as late September.
Volatility had been in a long-term downtrend due to market maker options hedging. Market makers hedge in the Deribit options market because TradFi Bitcoin products, such as BTC ETFs and Bitcoin portfolio companies, sell call options for yield. This strategy places systematic downward pressure on options prices and implied volatility.
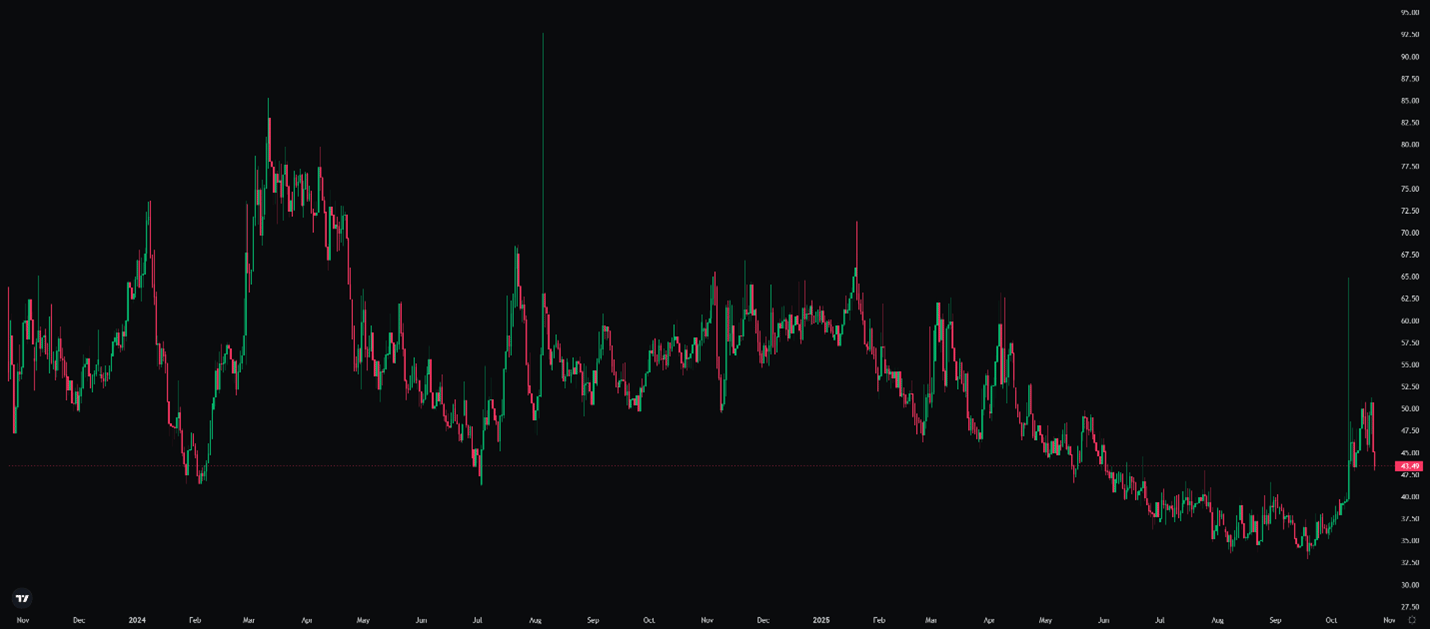
Figure 6: DVOL 2 Years; Bitcoin Index Price; Source: Deribit
Basis Spread
The basis spread, or the price of a futures contract over its spot price, remains positive across all maturities. The average (equal-weighted) basis spread rose from 5.23% APR to 6.22% APR week-over-week.
The futures curve is in a normal contango, with the front month trading below later maturities. The spread between the lowest- and highest-yielding maturities narrowed from 5.23% to 2.08%.
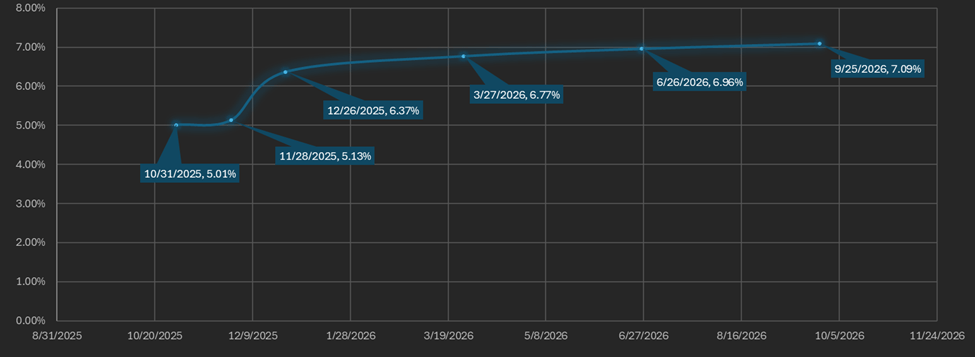
Figure 7: Futures Curve; Maturity Date, APR %
Macro
The October 10th liquidation event was contributed to by a potential tariff on China by President Trump. The announcement was issued after the US traditional market closed. President Trump has since stated he is willing to talk to President Xi about the export caps at the APEC forum on October 31st.
The Dollar Index ($DXY), which measures the U.S. dollar against a basket of other currencies, stands at 99.07 as of Thursday evening after bouncing from a three-year low of 96.25 reached on September 17th. Thirty-year bond yields are slightly lower at 4.6%.
Gold and silver prices reached record highs of $4,380.00 and $54.49 per ounce, respectively, last Thursday. Precious metals have since collapsed, with gold falling 6% in a single day, a 12-year record. The gold crash resembles the crypto sell-off from the week prior. The simultaneous decline in inflation-hedging assets and the strengthening DXY may signal a market preference for liquidity (USD).
Both U.S. Treasury bond implied volatility (MOVE) and equity market implied volatility (VIX) are near their long-term steady states. The VIX, which spiked 69% two Fridays ago amid the tariff scare, has now mostly normalized. It fell from 27.72% to 17.29% today, while the interest rate–adjusted MOVE index (MOVE Index / 10-Year Treasury Bond Yield) remains slightly above its multi-year low at 18.53%.

Figure 8: VIX, Daily Candles; 2 Years

Figure 9: Move Index/US10Y, Daily Candles; 2 Years
Sincerely,
The Hermetica Team