- Hermetica
- Posts
- Weekly Update - October 10, 2025
Weekly Update - October 10, 2025
Founder’s Letter Q3

IN THIS ISSUE
📰 Founder’s Letter Q3
🪙 Stablecoin Supply Hits $300B
💸 September Recap: Yield-Bearing Stablecoins
💰 USDh Yield Recap
📈 Weekly Market Review
Like what you see? Follow us on X so you don’t miss any future announcements:
Founder's Letter Q3
Our Founder and CEO, Jakob, published his quarterly letter.
Join Jakob to reflect on what we built, the progress made, and what’s next for Hermetica.
Stablecoin Supply Hits $300B
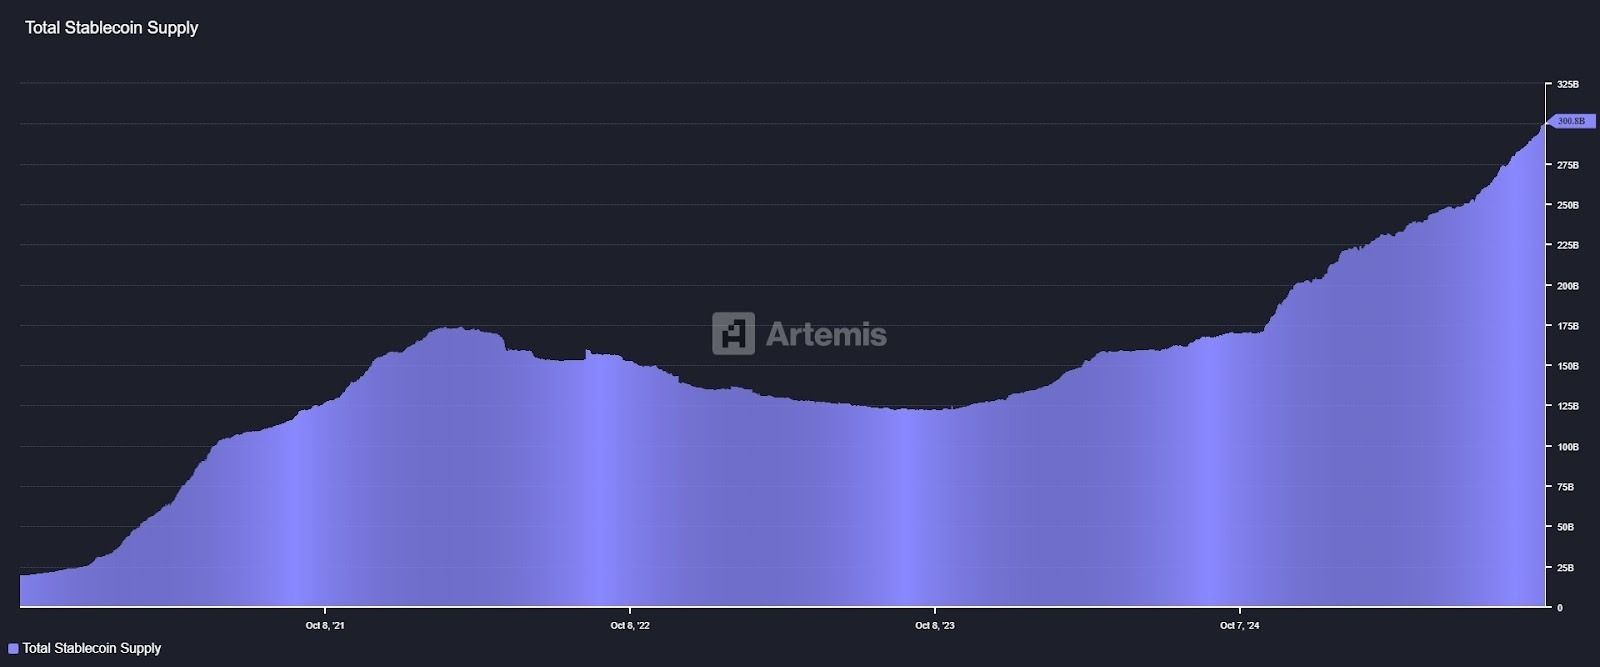
Global stablecoin supply continues to rise, with a new all-time high of $300B this week.
We expect to see further expansion as more capital moves on-chain and stablecoins become the preferred medium for global settlement.
September Recap: Yield-Bearing Stablecoins

In September, yield-bearing stablecoins distributed $91M in yield, a 17% increase from the prior record.
USDh is doing its part:
🔸 Peaked above 10% APY
🔸 Delivered positive yields 77% of days
🔸 Paid out daily
USDh Yield Recap
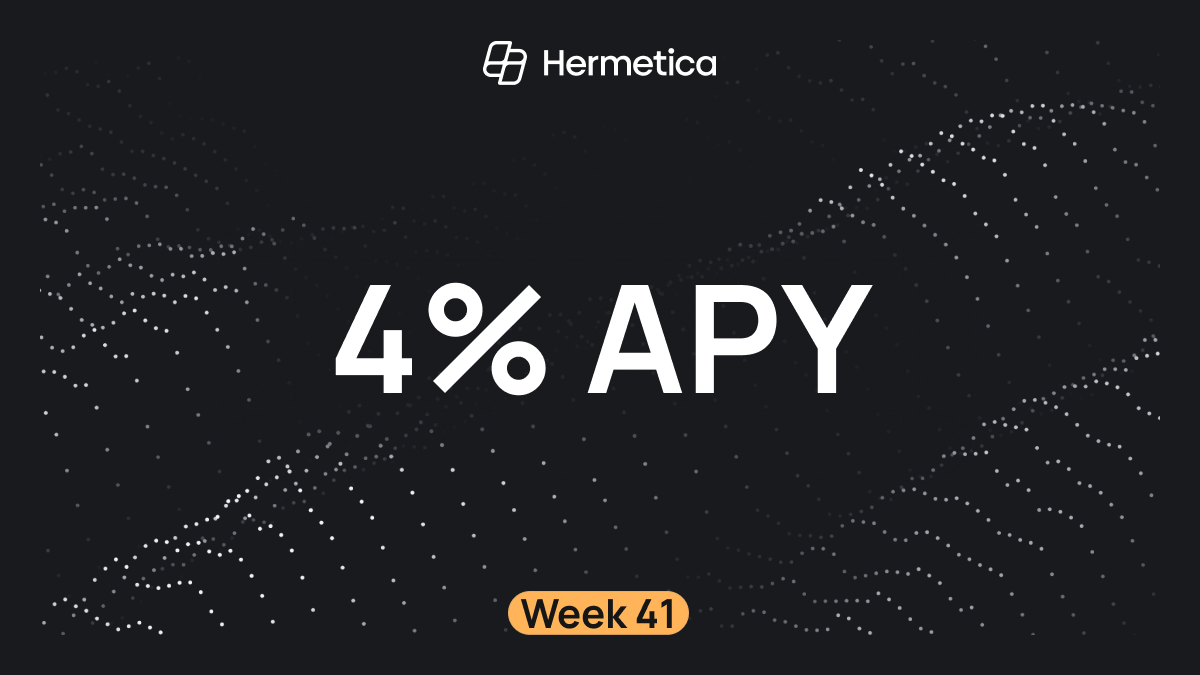
USDh clocked 4% APY this week.
41 weeks of free lessons for legacy stables on what yield looks like.
Will they ever learn?
Market Review
Bitcoin returned to the middle of its range after last week’s rally to all-time highs. Altcoin market caps dipped from $1.68T to $1.66T, while Bitcoin dominance increased 0.55% after a 0.19% decline.
DVOL: 39.88%
Average equal-weighted futures basis spread: 7.45% APR
Futures curve steepened and inverted; front contracts declined
Perpetual futures funding rates declined to near zero
Funding rates peaked at 45.99% on Saturday, October 4th
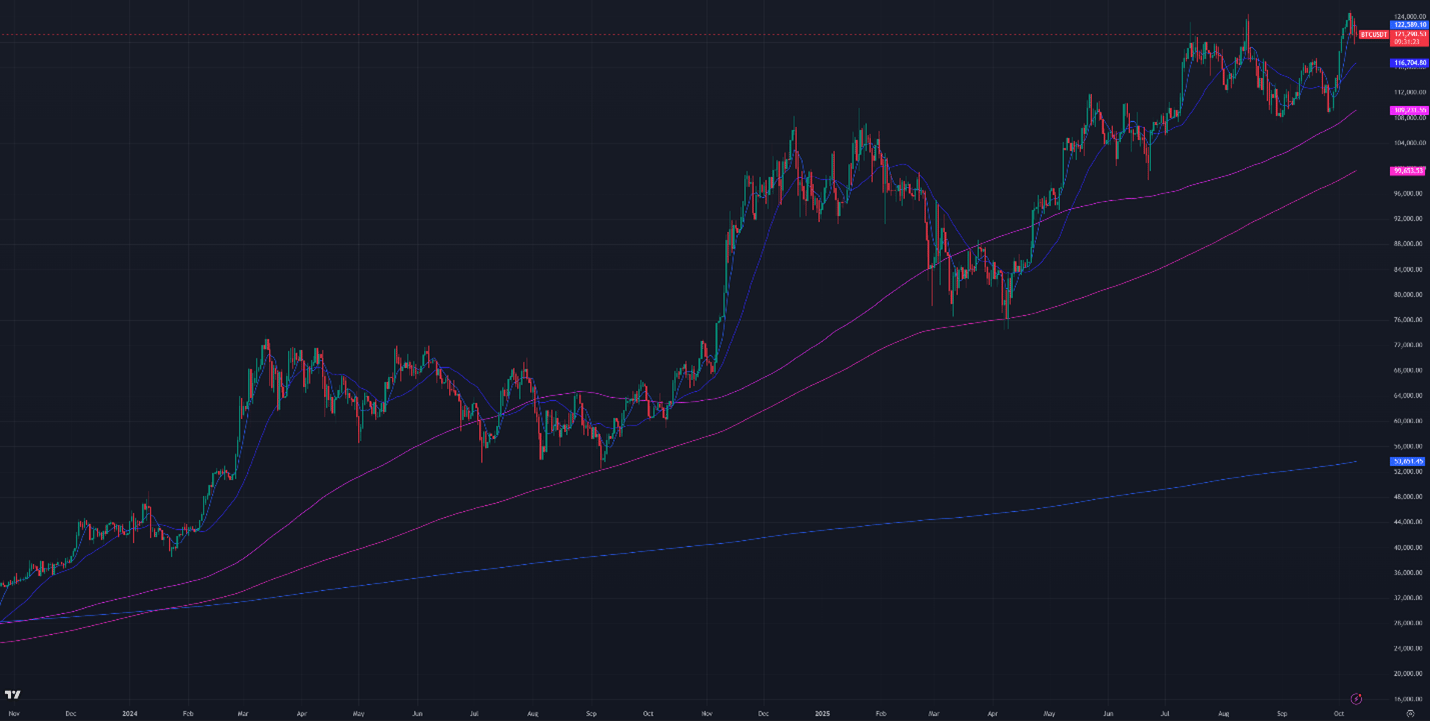
Figure 1: BTC Price, Daily Candles, & Moving Averages; 2 years; Source: Binance
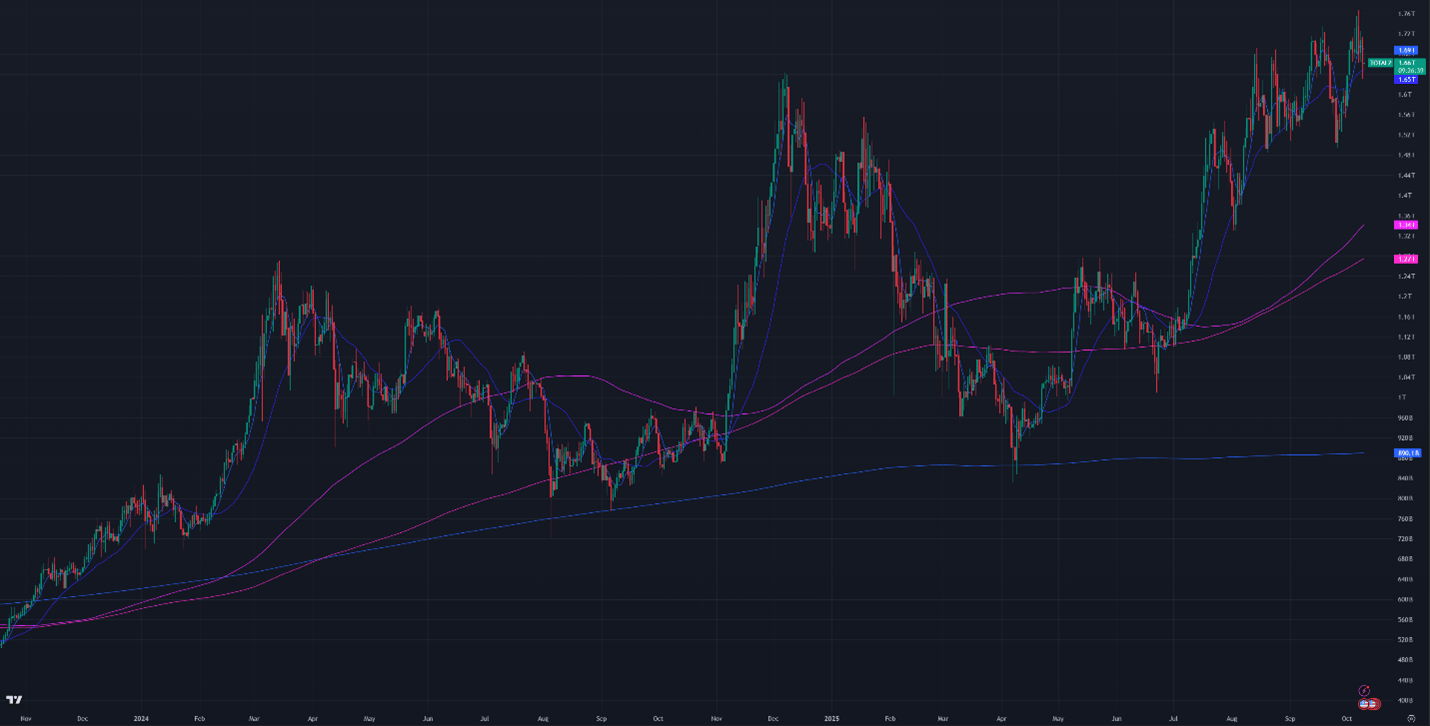
Figure 2: Crypto Market Cap Excluding Bitcoin, Daily Candles, & Moving Averages; 2 years
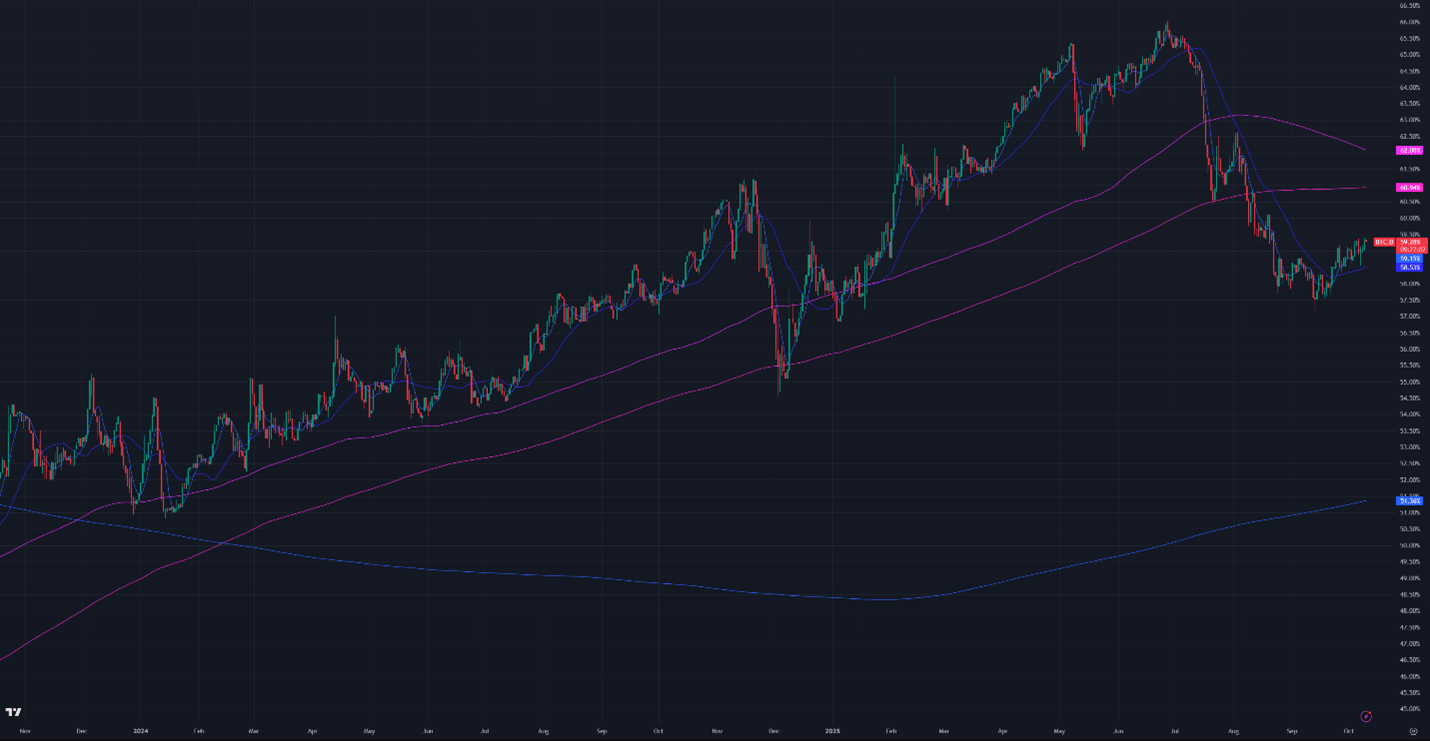
Figure 3: Bitcoin Dominance, Daily Candles, & Moving Averages; 2 years
The moving averages (MA) in Figure 1 are:
Current Price: $121,300
7-Day MA: $122,600
30-Day MA: $116,700
180-Day MA: $109,200
360-Day MA: $99,700
200-Week MA: $53,700
Bitcoin slipped below the 7-day moving average (MA), continuing its mean-reversion trend.
Trend Following
Returns for a Bitcoin 7-day and 30-day long trend-following portfolio are down 2.71% from January’s ATH. The portfolio caught an uptrend over the weekend but lost the gains during the week. Low liquidity and rising call volume make Bitcoin prone to sharp swings that mislead quantitative systems, triggering false signals that would stay below thresholds in more liquid markets.
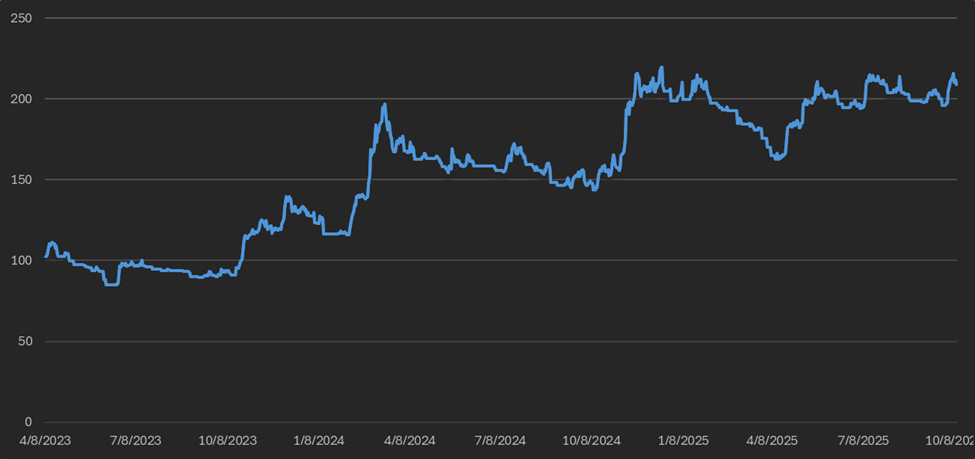
Figure 4: Bitcoin 7 & 30-day Trend Following Strategy Returns
BTC ETF Flows
Net inflows hit an all-time high of $3.7B this week, up from an already strong $1.83B last week. Ethereum ETFs saw inflows of $897M.

Figure 5: Bitcoin ETF Flows, Daily Bars; Source: The Block
Volatility
Bitcoin’s implied volatility (DVOL) rose slightly from 37.98% to 39.88% this week, staying above multi-year lows. Volatility is in a long-term downtrend due to systematic market maker hedging in the Deribit options market.
TradFi Bitcoin products like ETFs and portfolio companies are increasingly selling call options for yield, creating systematic downward pressure on option prices and implied volatility. Yield Max’s $MSTY, for example, sells $4.5B in notional calls on Strategy (formerly MicroStrategy) stock each month and quarter. Hundreds of hedge funds run similar trades on miners and Bitcoin ETFs. Market makers buy these calls and resell on Deribit to lock in spreads, keeping DVOL capped even as rising prices would normally trigger delta hedging.
The effects of systematic call selling are visible in price action. After quarterly options expired at the end of September, Bitcoin prices surged. When call sellers opened positions, market makers bought calls and hedged by shorting spot Bitcoin or Bitcoin ETFs, likely impacting ETF outflows and short-term selling pressure. When options expired out of the money on September 25, market makers bought back their hedges, helping drive the post-OPEX price rebound and ETF inflows.
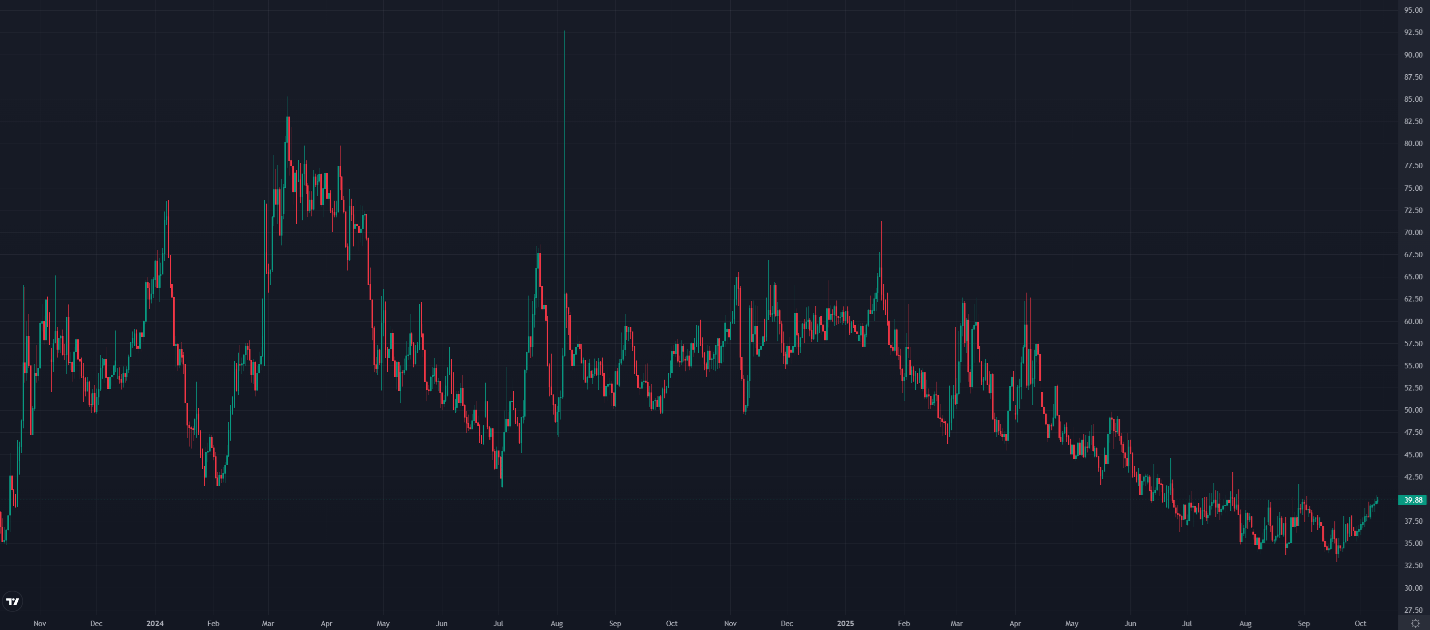
Figure 6: DVOL 2 Years; Bitcoin Index Price; Source: Deribit
Basis Spread
The futures basis remains positive across all maturities, with the average spread slipping from 7.87% to 7.45% APR week-over-week.
The futures curve is in normal contango, with the front month trading below later maturities. The spread between the lowest- and highest-yielding contracts widened from 0.47% to 1.11%. Deribit’s Bitcoin futures curve remains indirectly suppressed by TradFi call selling.
Futures open interest is 33% below December levels despite higher spot prices, while options open interest is at all-time highs after adjusting for the recent expiration.
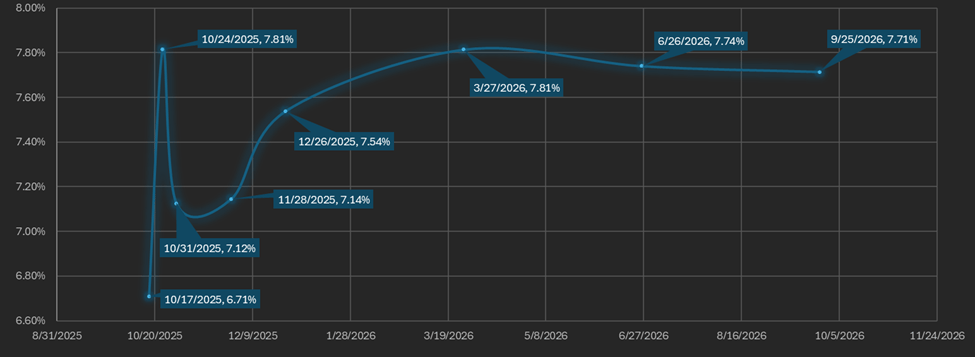
Figure 7: Futures Curve; Maturity Date, APR %
Macro
On September 17, the Fed cut the federal funds rate by 25 bps at its 6th FOMC meeting. Canada cut interest rates by 25 bps on September 17th, the same day as the U.S The European Central Bank (ECB) cut rates by 25 bps on June 6th but has not cut since. The Swiss National Bank cut rates by 25 bps to 0% in June, while the People’s Bank of China (PBOC) left rates unchanged. The Bank of England (BOE) lowered rates by 25 bps on August 7th, and the Bank of Australia cut rates by 25 bps on August 12th.
The Dollar Index ($DXY), which tracks the U.S. dollar against a basket of major currencies, is 98.98 as of Thursday evening after a three-year low of 96.25 on September 17th. 30-year bond yields are slightly lower at 4.66%.
U.S. Treasury bond implied volatility (MOVE) is near its long-term steady state, while equity market implied volatility (VIX) spiked 25% on Friday and is now slightly above its steady-state level. The VIX rose to 20.8%, up from 16.28% last week, while the interest rate-adjusted MOVE index (MOVE Index / 10-Year Treasury Bond Yield) remains near multi-year lows at 18.22%.
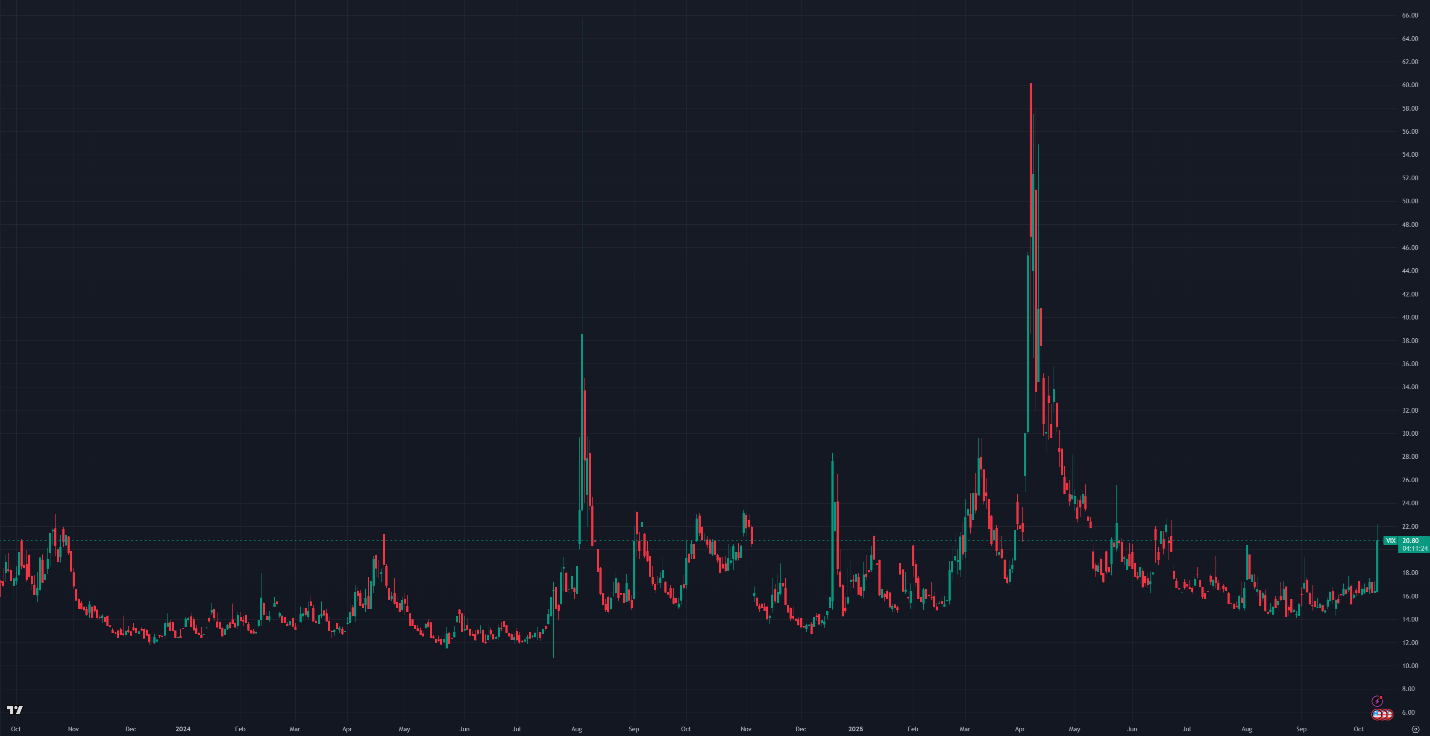
Figure 8: VIX, Daily Candles; 2 Years
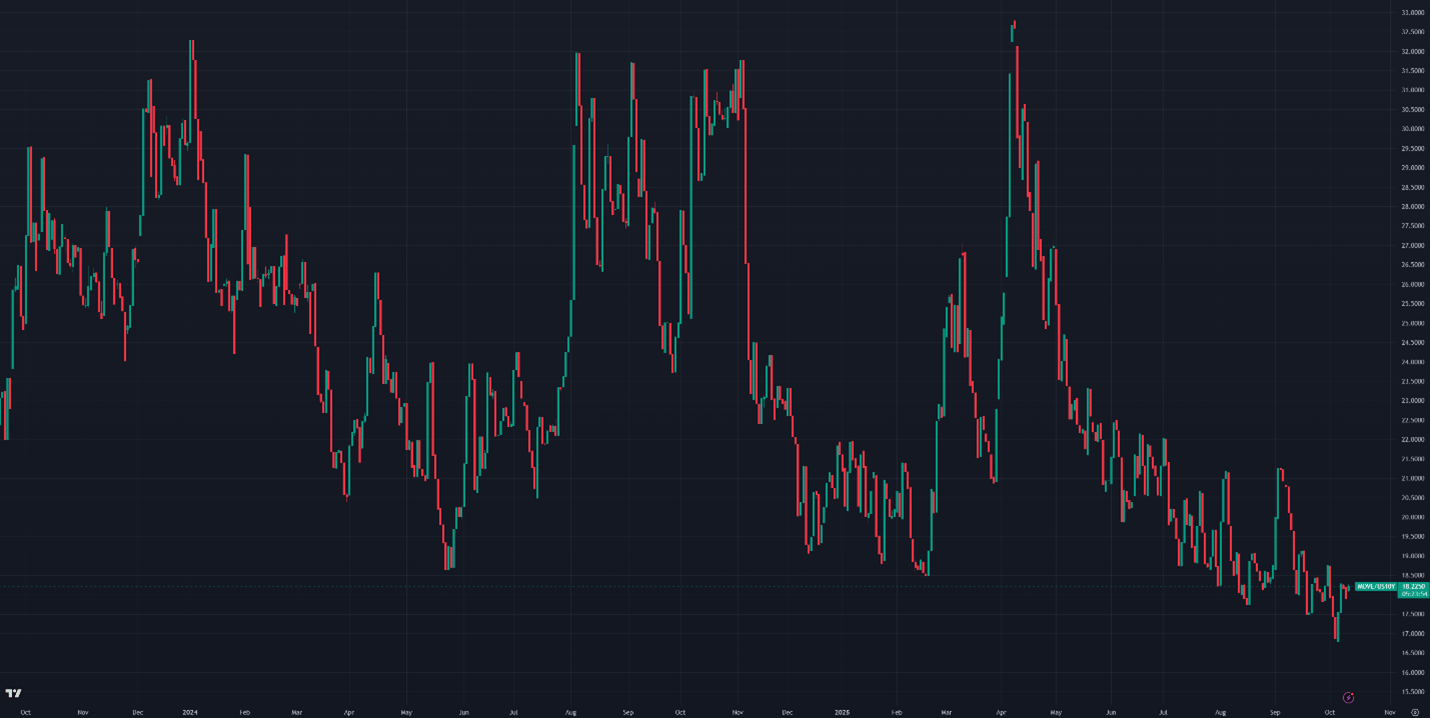
Figure 9: Move Index/US10Y, Daily Candles; 2 Years
Sincerely,
The Hermetica Team