- Hermetica
- Posts
- Weekly Update - July 25, 2025
Weekly Update - July 25, 2025
USDh's Transparency Standard

IN THIS ISSUE
💵 USDh’s Transparency Standard
📰 HexTrust Integrates Stacks
💰 USDh Yield Recap
☎️ Hermetica Hangout: Zest
📈 Weekly Market Review
Like what you see? Follow us on X so you don’t miss any future announcements:
USDh’s Transparency Standard

This week, we shared a blog post breaking down how we approach transparency across everything we build.
From real-time APY tracking to monthly reserve attestations, every part of our system is designed to be visible and verifiable.
In a space where trust is often assumed, we think it should be earned.
HexTrust Integrates Stacks

HexTrust, an institutional-grade custodian, now supports direct staking of STX and sBTC.
Institutional clients can stake STX and access sBTC, a 1:1 Bitcoin-pegged asset designed for DeFi on Stacks.
Rewards are paid in BTC, directly to client vaults, with no external wallet setup required.
USDh Yield Recap
If corporate bonuses looked like USDh APYs, we’d all be retiring by 30.
18% APY for Week 30, and we didn’t make you sign 500 papers or prove you’re human.
Hermetica Hangout: Zest

This week, we hosted Zest Protocol to learn how they’re building credit rails on Bitcoin. Catch the full recording here.
Next week, join us for another session spotlighting a team building core financial infrastructure on Bitcoin. Set your reminder, you won’t want to miss it.
Market Review
Bitcoin has consolidated around $117,000 this week following its all-time high breakout two weeks ago. After rallying to $123,000 last Monday, the price was rejected and has since traded consistently below the $120,000 level. Altcoins rallied on the $120,000 Bitcoin rejection. Both altcoins and Bitcoin are seeing reversals today.
DVOL remains near a 2-year low despite trending upward
The average equal-weighted futures basis spread is flat, increasing by only 0.05% APR to 8.39% APR but remains below May’s high of 9.15% APR%
The front-end of the futures curve rose while the back-end declined week-over-week, resulting in a downward-sloping contango that flattens noticeably starting in September
Perpetual futures (perps) funding rates have been positive all week, peaking Wednesday at 33% APR
Bitcoin dominance declined by 0.35% week-over-week, rebounding off its 365-day moving average earlier in the week
Aggregated altcoin market capitalization held flat week-over-week at $1.47T, following a sharp rise from $1.27T to $1.48T last week
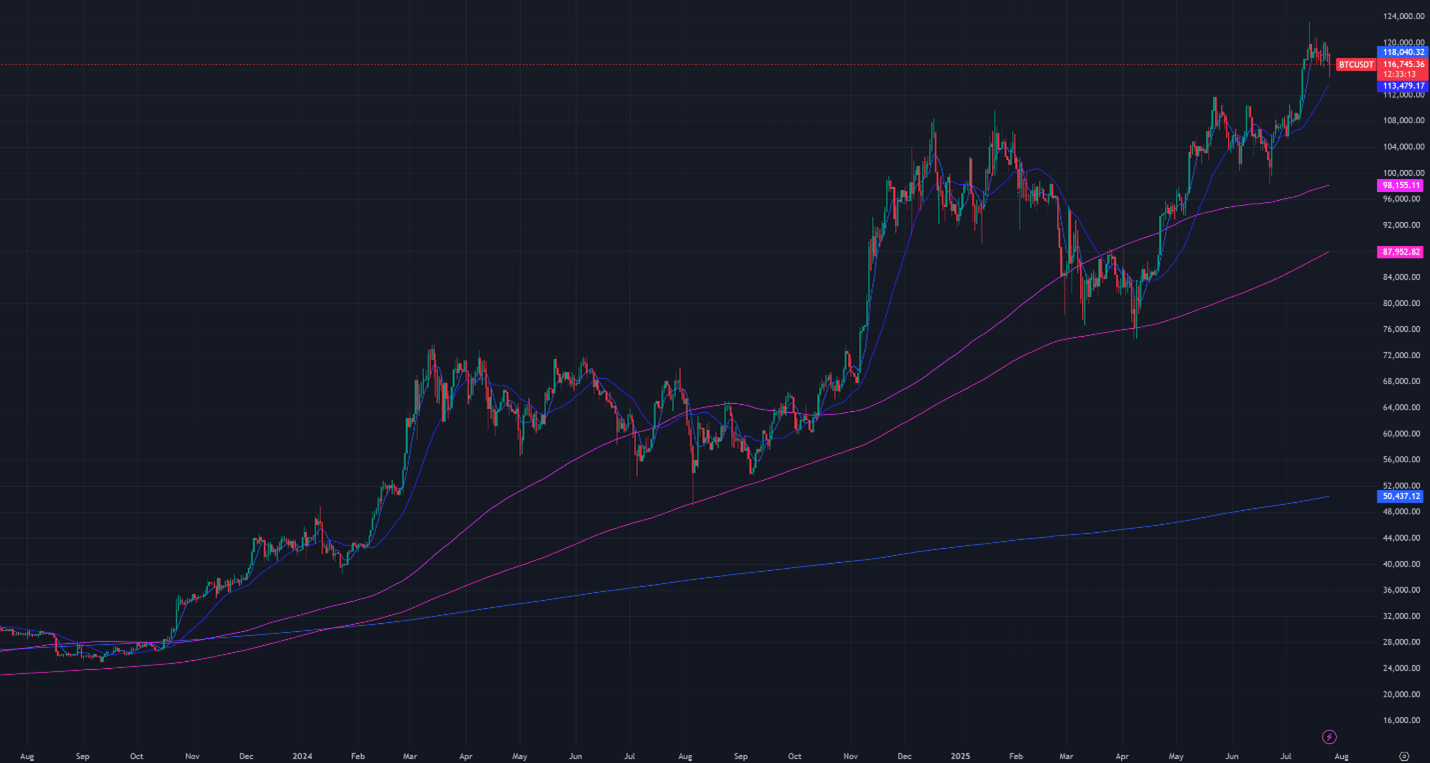
Figure 1: BTC Price, Daily Candles, & Moving Averages; 2 years; Source: Binance
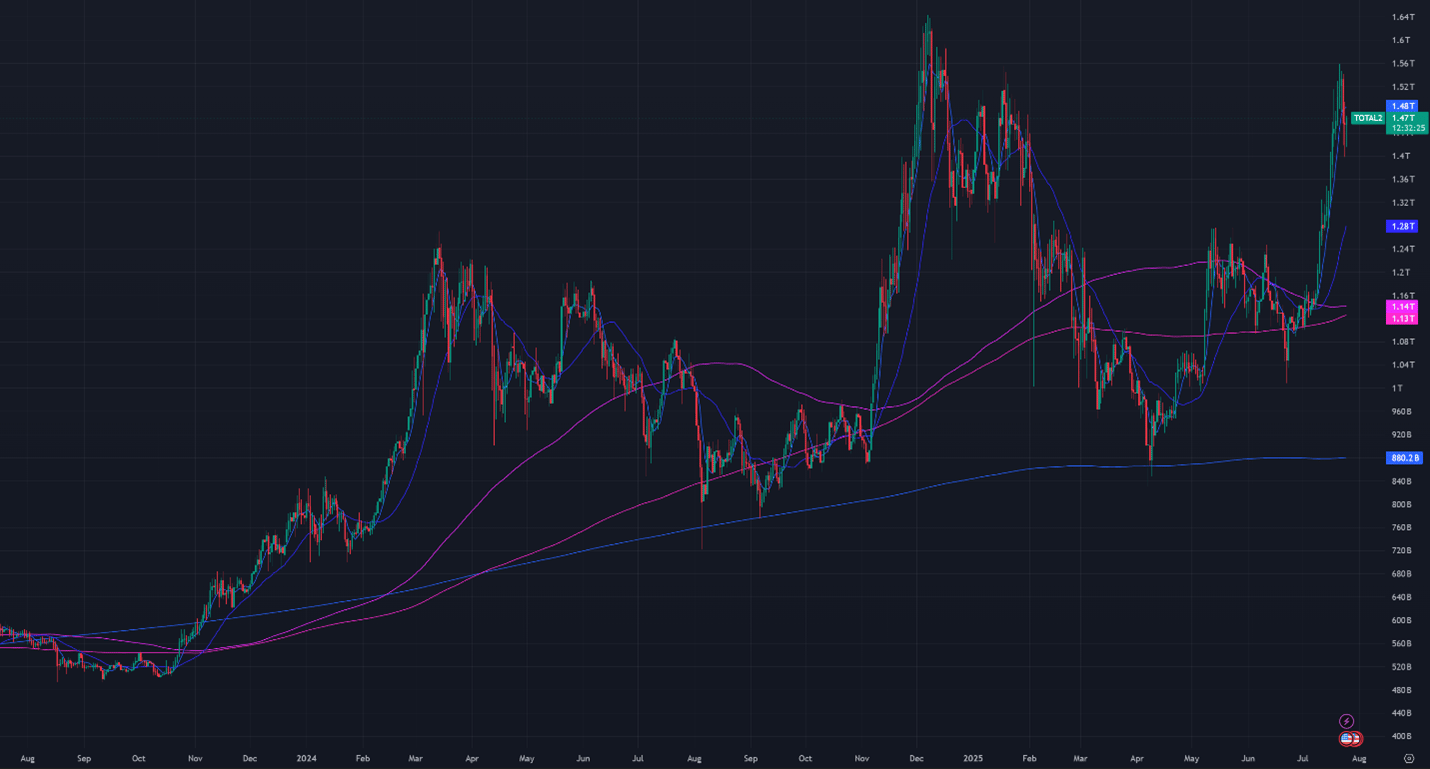
Figure 2: Crypto Market Cap Excluding Bitcoin, Daily Candles, & Moving Averages; 2 years
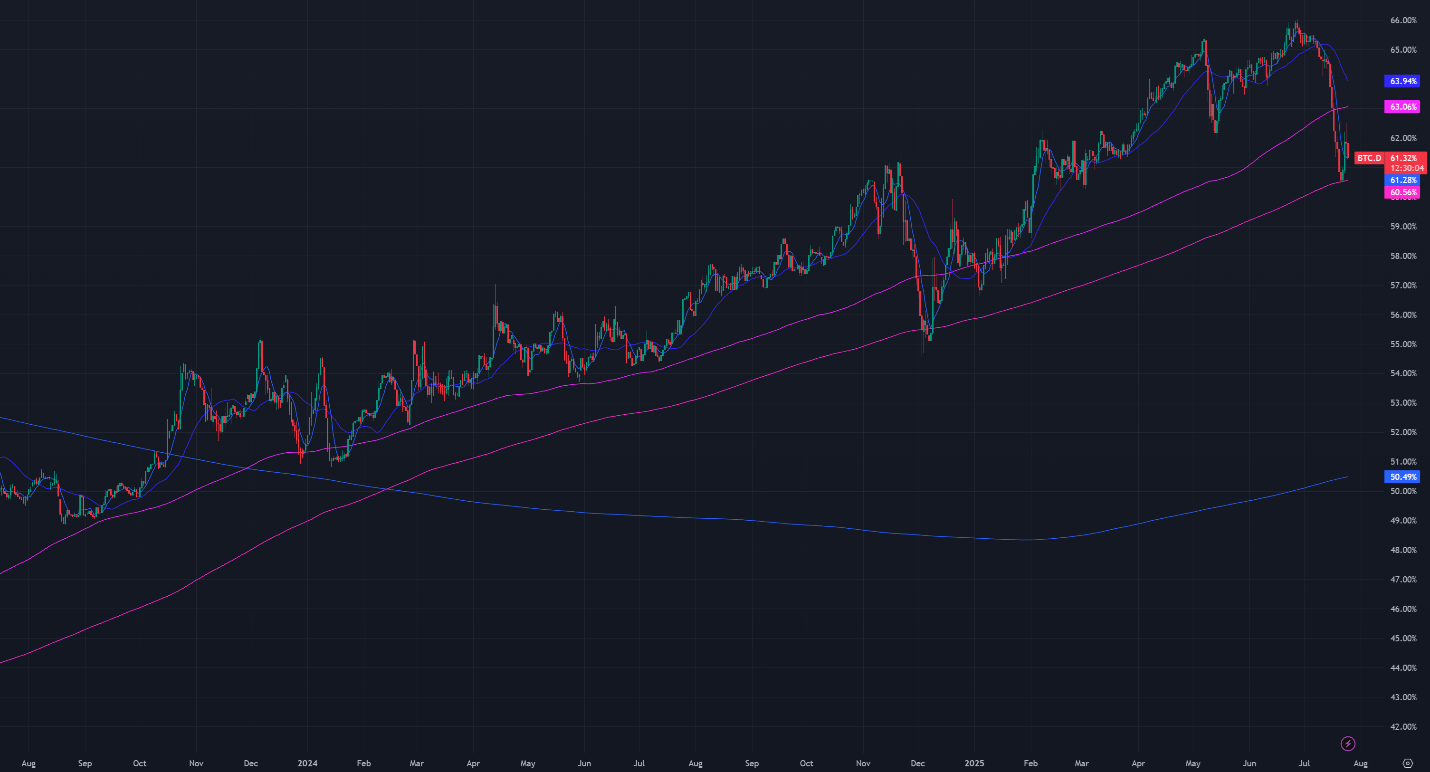
Figure 3: Bitcoin Dominance, Daily Candles, & Moving Averages; 2 years
The moving averages (MA) in Figure 1 are:
Current Price: $117,000
7-Day MA: $118,800
30-Day MA: $113,000
180-Day MA: $98,000
360-Day MA: $88,000
200-Week MA: $50,000
DBitcoin has recently dipped below its short-term 7-day moving average (MA) after consolidating for around 10 days. Despite this minor pullback, it remains well above the 30-day MA, indicating that the broader uptrend remains intact. Notably, Bitcoin's breakout above its previous all-time high (ATH) occurred on strong volume; a technically bullish signal that supports the case for continued upward momentum.
While Bitcoin continues to push ATH levels, altcoins have begun to outperform, particularly since Bitcoin’s rally lost momentum last Tuesday. Bitcoin dominance has recently fallen below its 180-day MA and is now approaching a potential breach of its 365-day MA.
Trend Following
The Bitcoin 7-day and 30-day long trend-following portfolio is currently down just 0.2% from its all-time high (ATH) set in January. This marks a significant recovery compared to two months ago, when the portfolio was down 22.99%.
These long trend strategies successfully captured the breakout to new ATHs and have maintained their positions since. While they faced challenges during the failed breakout around the $120,000 level, they remain well-positioned to benefit from any renewed upward momentum in the market.
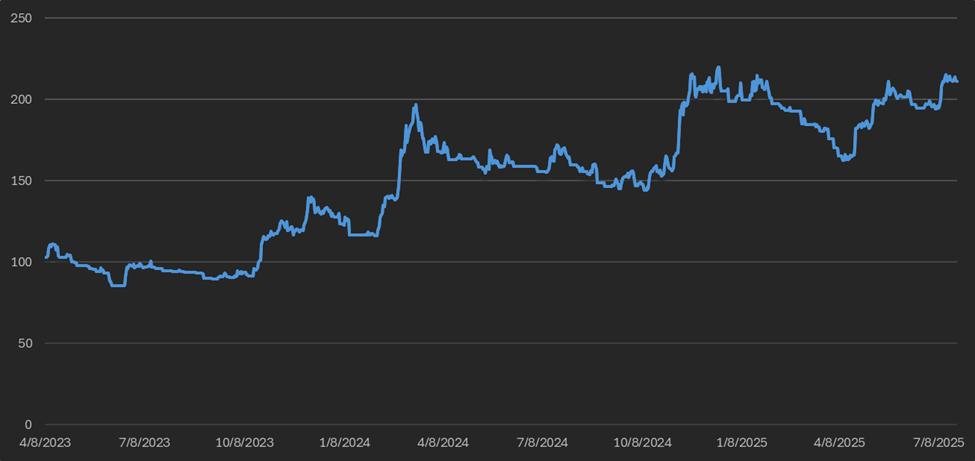
Figure 4: Bitcoin 7 & 30-day Trend Following Strategy Returns
BTC ETF Flows
Net outflows this week were $305M, a sharp reversal from the historic inflows of $3.052B recorded last week. Net inflows have now declined to their lowest levels in over a month. In contrast, Ethereum ETFs have experienced a surge in interest, with inflows reaching over $1.796B this week.

Figure 5: Bitcoin ETF Flows, Daily Bars; Source: The Block
Volatility
Bitcoin’s implied volatility (DVOL) currently stands at 40.88% after reaching a recent low of 36% earlier this month, the lowest level observed since October 2023. Notably, the muted DVOL response during Bitcoin’s breakout above previous all-time highs suggests that market makers may already be hedged.
A growing trend in TradFi Bitcoin exposures like BTC ETFs and Bitcoin-linked equities is the systematic sale of call options as a yield-generating strategy. This activity is exerting persistent downward pressure on both options prices and implied volatility.
For instance, the YieldMax ETF ($MSTY) sells approximately $4.5 billion in notional call options on Strategy (formerly MicroStrategy) stock on a monthly and quarterly basis. This strategy is widely replicated: hundreds of hedge funds are employing similar call-selling approaches on Bitcoin-correlated assets, including mining stocks and Bitcoin ETFs.
These call overwriters typically sell to market makers, who in turn hedge their exposure by selling equivalent calls on platforms like Deribit, capturing the spread between the institutional and crypto-native markets. This layered hedging dynamic is contributing to a structural cap on DVOL, even as rising spot prices would traditionally force market makers to increase delta hedging activity and bid up volatility.
For discretionary options traders on Deribit, this environment creates favorable conditions. The systematic undervaluation of call options, especially at-the-money strikes, means calls are being consistently priced below their fair value based on realized volatility potential. This presents opportunities for traders positioned to exploit volatility mispricings.
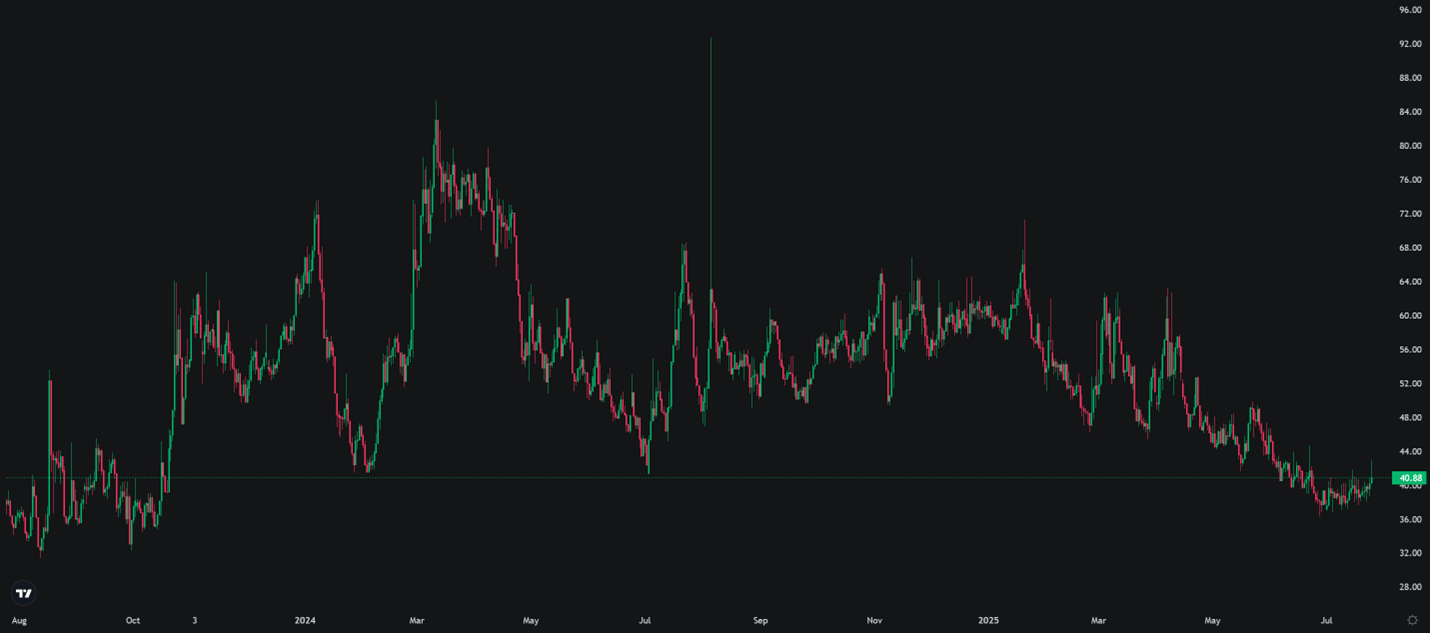
Figure 6: DVOL 2 Years; Bitcoin Index Price; Source: Deribit
Basis Spread
The basis spread, or the price of a futures contract over its spot price, is positive across all maturities. On average (equal-weighted), the annualized basis rose slightly by 0.05% this week, from 8.34% APR to 8.39% APR. Despite this marginal increase, the spread is still 0.76% APR (or 8.28%) below its May 23rd peak.
The current futures curve exhibits an inverted contango structure. The front-month contract (expiring August 1st) commands the highest yield at 12.17% APR. Yields then decline through the rest of August before stabilizing through to the long-dated June 2026 contract, which is priced at 7.8% APR. There is a 4.84% yield spread between the highest and lowest maturities. Excluding the volatile front-week contract, the spread narrows to 1.41%, indicating a relatively flat curve beyond near-term expiries.
Deribit’s Bitcoin futures curve appears to be suppressed by TradFi call selling. Futures volume is about 33% lower than it was in January despite the increase in spot price.
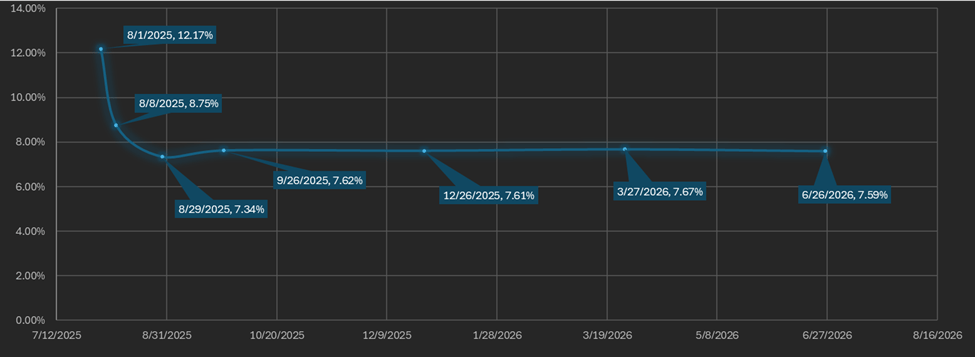
Figure 7: Futures Curve; Maturity Date, APR %
Macro
On June 18th, the Federal Reserve held its fourth FOMC meeting of the year. Powell did not cut rates nor did he announce any reduction in quantitative tightening (QT) from the $5B level set at the March meeting. The U.S. Federal Reserve holds its 5th FOMC meeting on July 30th where analysts expect no major policy changes. U.S. President Trump’s Treasury Secretary Scott Bessent stated they are in the process of replacing Powell with a new Fed chair.
On June 6th, the European Central Bank (ECB) lowered its benchmark interest rate by 25 basis points, the second consecutive monthly cut. The Swiss National Bank (SNB) also reduced rates by 25 bps this month, bringing its policy rate to 0%. In contrast, the Bank of England (BOE) and the People’s Bank of China (PBOC) held rates steady. Notably, the Federal Reserve diverged from its global peers by maintaining its current policy stance.
Last week the house passed the Digital Asset Market Clarity Act (DAMC) and the GENIUS Act which established regulations on the crypto industry and stablecoin providers, respectively. These bills establish guardrails for the industry but also open the door for establishment investors to enter the space.
The often-cited Bitcoin-M2 money supply correlation (Figure 8) may be attributed to the long-term uptrend in Bitcoin since 2023, but it is not a precise guide for when uptrends begin or end.

Figure 8: M2 Money Supply (Blue), BTC price (Red); 5 years; Source Federal Reserve & Binance
The M2 money supply represents the total amount of money in circulation, including physical currency, checking and savings deposits, time deposits, and money market funds. Fluctuations in M2 are driven by changes in system-wide leverage, either through private sector lending (primarily commercial bank credit creation) or Federal Reserve balance sheet policy, such as quantitative easing (QE) or quantitative tightening (QT).
Since 2022, the Federal Reserve has been actively pursuing QT, reducing its balance sheet and thereby contracting the M2 money supply. Despite this, M2 has recently shown signs of growth, which implies that the increase is being driven by rising leverage in the private sector.
Private credit can raise the risk of deflationary shocks if borrowers face challenges servicing their debts. An overleveraged private sector can also become highly sensitive to changes in liquidity, interest rates, or asset valuations.
A historical precedent occurred in 2022 when Bitcoin’s secondary price peak preceded the peak in M2 by approximately six months. This lag suggests that crypto markets may sometimes serve as a forward indicator of liquidity conditions.
The Dollar Index ($DXY), which tracks the U.S. dollar against a basket of major currencies, rose to 97.73 as of Thursday evening, up 1.4% from the 3-year low reached on July 1st. DXY has climbed alongside broader markets since the start of the month.
Meanwhile, 30-year Treasury yields hit 5.15% on May 22nd, their highest level since the end of the Fed’s 2023 rate-hiking cycle. Yields remain elevated at 4.96%, near multi-year highs.
Historically, $DXY and U.S. Treasury yields have shown a strong positive correlation, as illustrated in Figure 9.
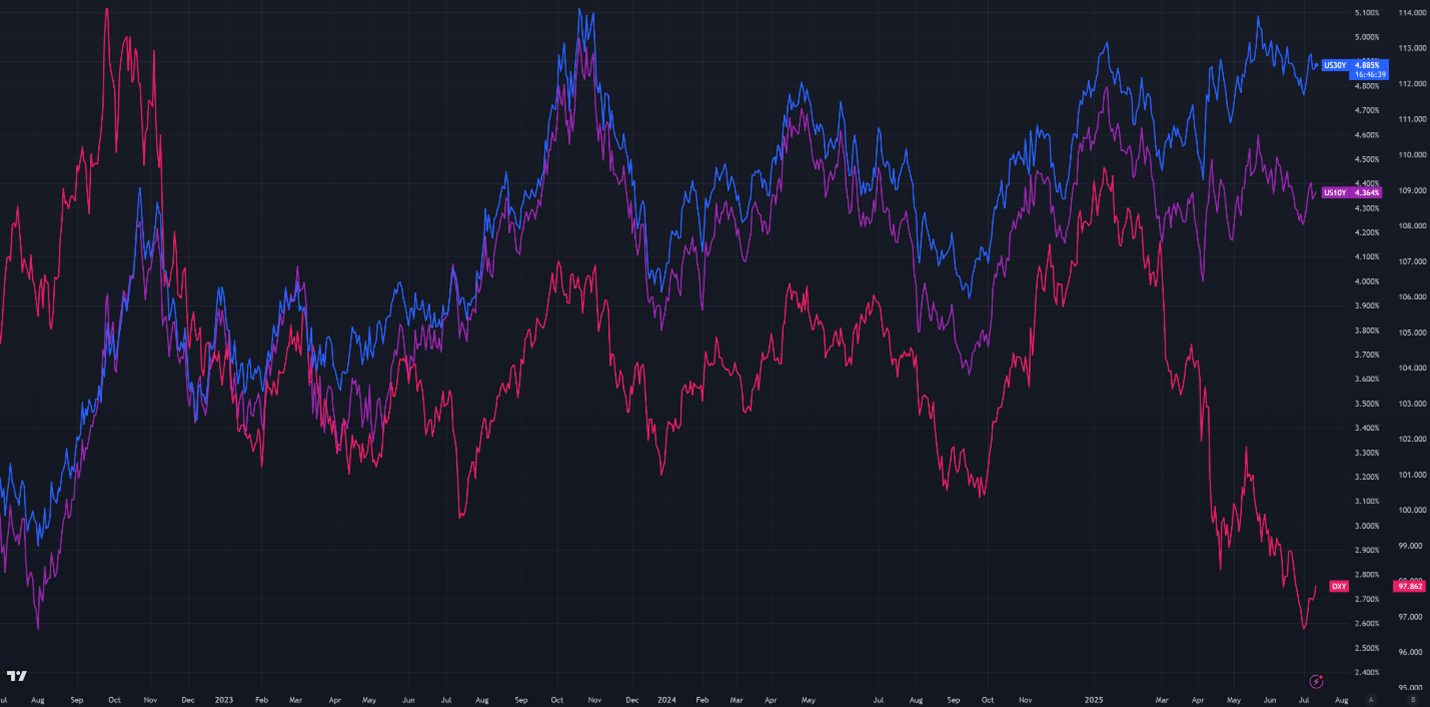
Figure 9: DXY Index returns (Red), 30-year T-Bond yield returns (Blue), and 10-year T-Bond yield returns (Purple), 3 years
Implied volatility across both equity and bond markets remains anchored near long-term averages. The recent Middle East conflict had only a muted effect on equity volatility, and with tensions easing, the VIX has dropped to 15.26, down from 16.48 the previous Thursday, marking a new local low. Similarly, bond market volatility has softened, with the MOVE index falling to 82.75 from 85.57.
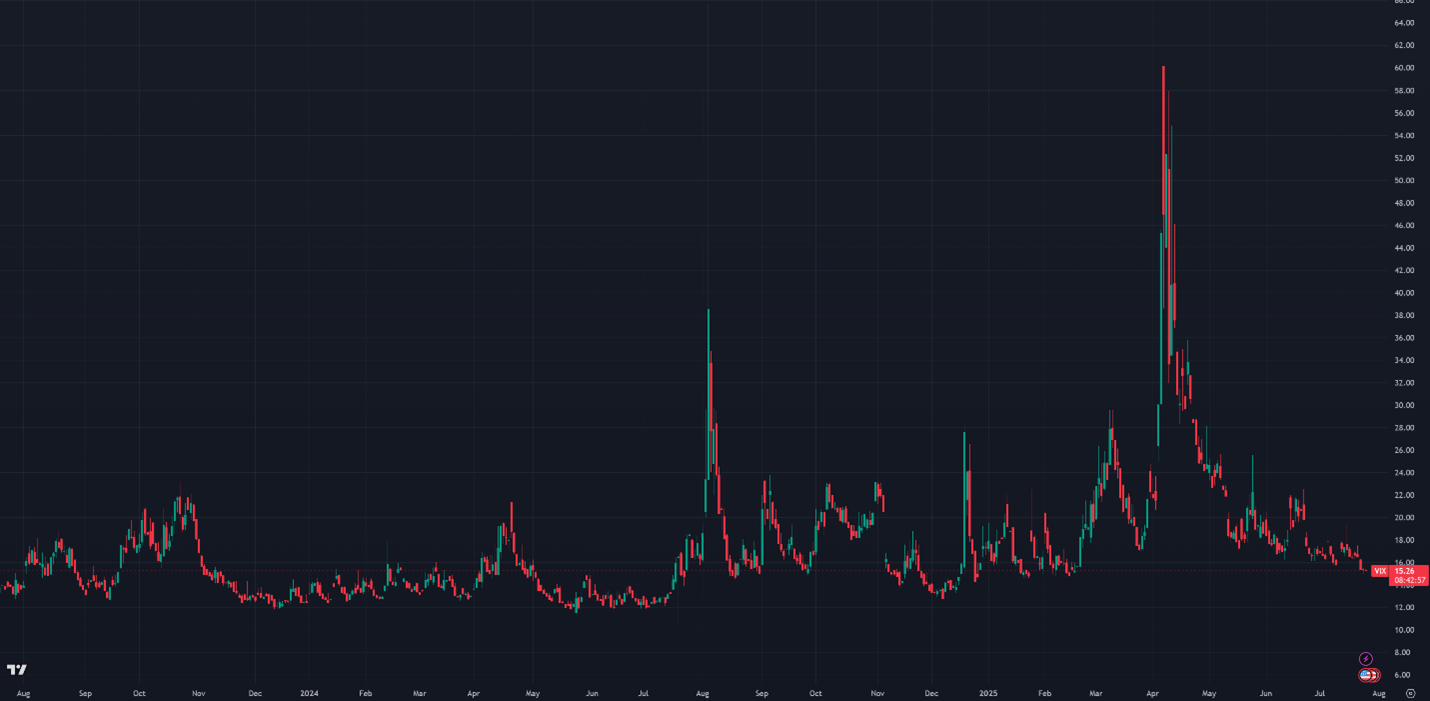
Figure 10: VIX, Daily Candles; 2 Years
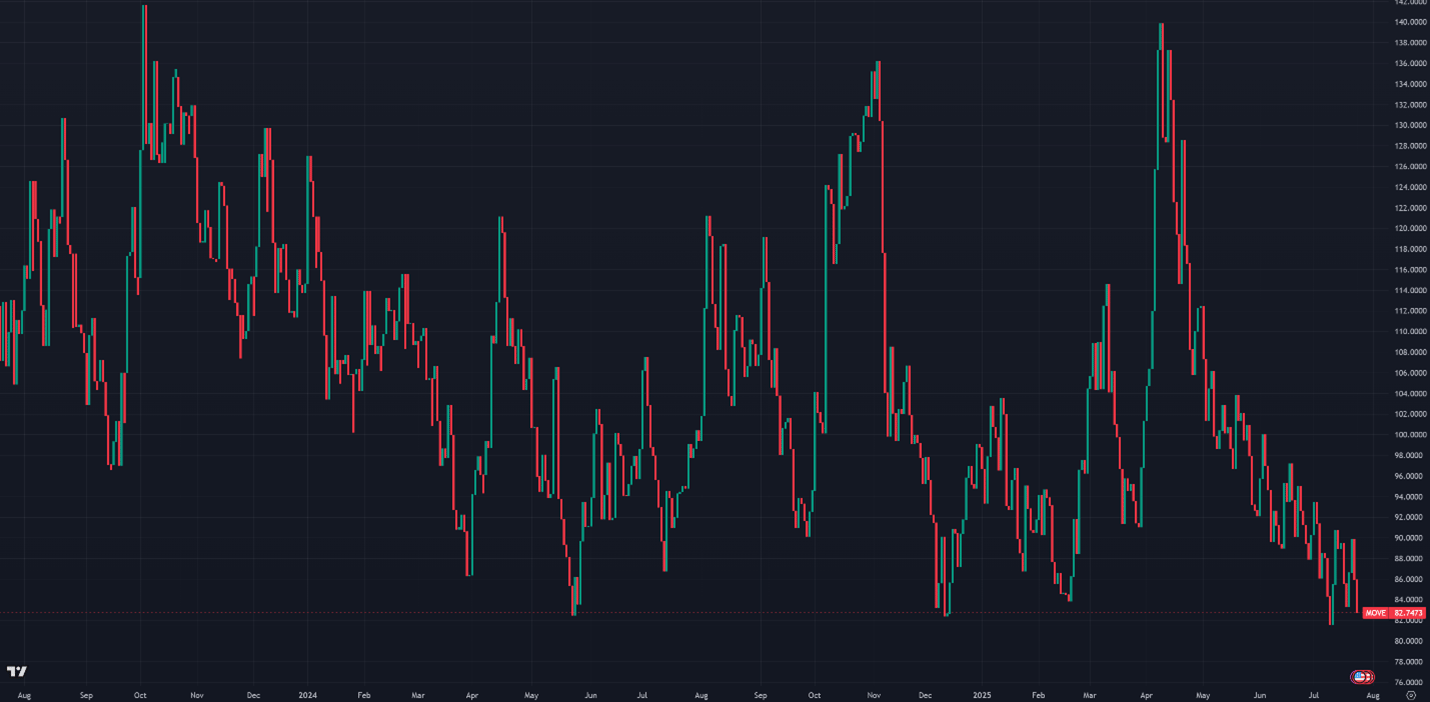
Figure 11: Move Index, Daily Candles; 2 Years
Sincerely,
The Hermetica Team