- Hermetica
- Posts
- Weekly Update - July 18, 2025
Weekly Update - July 18, 2025
Stacks SIP-031 Passes

IN THIS ISSUE
🗳️ Stacks SIP-031 passes
📰 Hermetica manifesto
💰 USDh yield recap
☎️ Hermetica Hangout: Bitflow
📈 Weekly market review
Like what you see? Follow us on X so you don’t miss any future announcements:
Stacks SIP-031 Passes

SIP-031, Stacks’ growth emissions proposal, has officially passed.
The proposal enables the Stacks Foundation to mint new STX tokens to fund a multi-year growth plan focused on bootstrapping protocols, driving user adoption, and accelerating core development.
The ecosystem is now equipped to position Stacks as the leading Bitcoin Layer for DeFi.
Hermetica Manifesto
This week, we published the Hermetica Manifesto, our vision for a Bitcoin-powered financial system.
We believe the future of finance must be built on incorruptible foundations, starting with Bitcoin, and extended through scalable infrastructure like Layer 2s.
The manifesto outlines why Bitcoin DeFi matters, what it takes to build it, and how Hermetica is helping drive that future forward.
If you’re aligned with the mission, it’s worth a read.
USDh Yield Recap
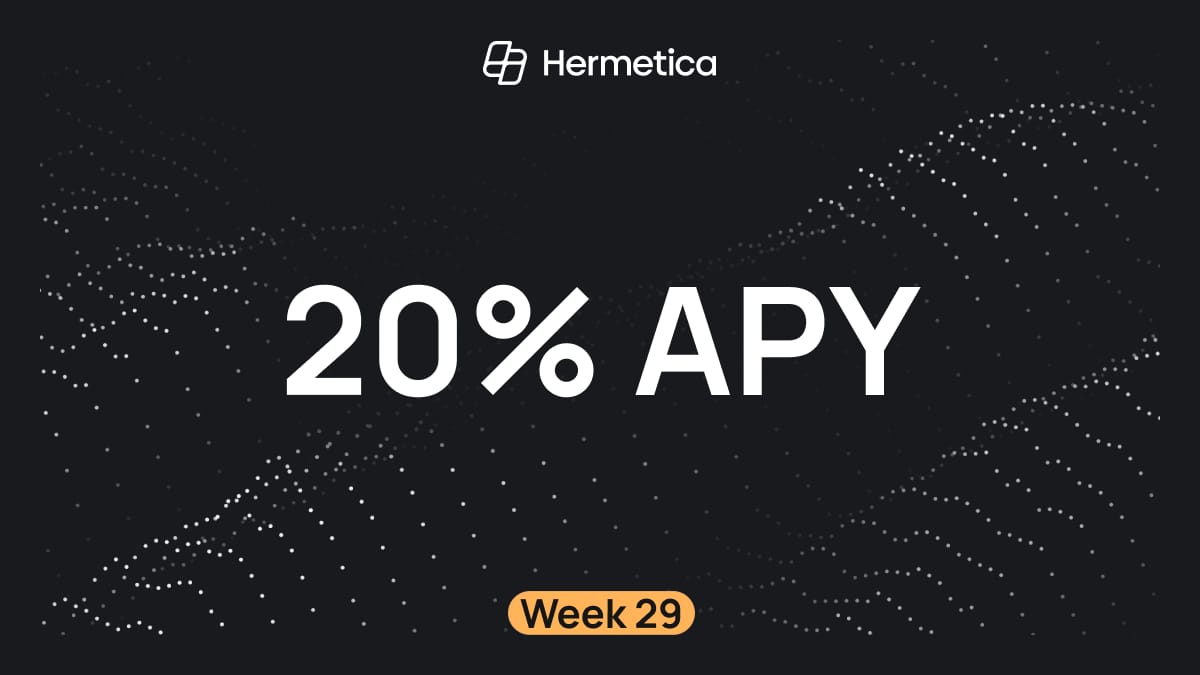
This week, we’re serving up 20% APY. USDh continues to deliver steady yields while Bitcoin does its thing.
You can earn with us, or you can watch from the sidelines. The choice is easy.
Hermetica Hangout

This week, we hosted Bitflow for a discussion on how liquidity moves across Bitcoin layers and how Bitflow enables seamless access to BTCfi. Catch the full recording here.
Next week, we’re hosting Zest Protocol for a deep dive into how Zest is building credit rails on Bitcoin. Set your reminder, you won’t want to miss it.
Market Review
Bitcoin continues its bull run this week, breaking out to $123,500 on Monday before being rejected back to $115,500 by Tuesday, then rallying to $120,000 by the weekend. The $120,000 rejection marked the beginning of an altcoin rotation. Altcoins, such as Ethereum, rallied double digits through the latter half of the week.
DVOL remains near a two-year low but is gradually trending upward
The average equal-weighted futures basis spread rose 1.58% to 8.34% APR, still below May’s peak of 9.15%
The front-end of the futures curve is in a downward-sloping contango but flattens noticeably starting in September
Perpetual futures funding rates were positive all week, peaking at 37.23% APR on Monday during the failed breakout above $120,000
Aggregated altcoin market caps surged from $1.27T to $1.48T, up $330B over the last two weeks
Bitcoin dominance fell sharply by 2.98%, the steepest decline since November 2024, and has now broken below its 180-day moving average
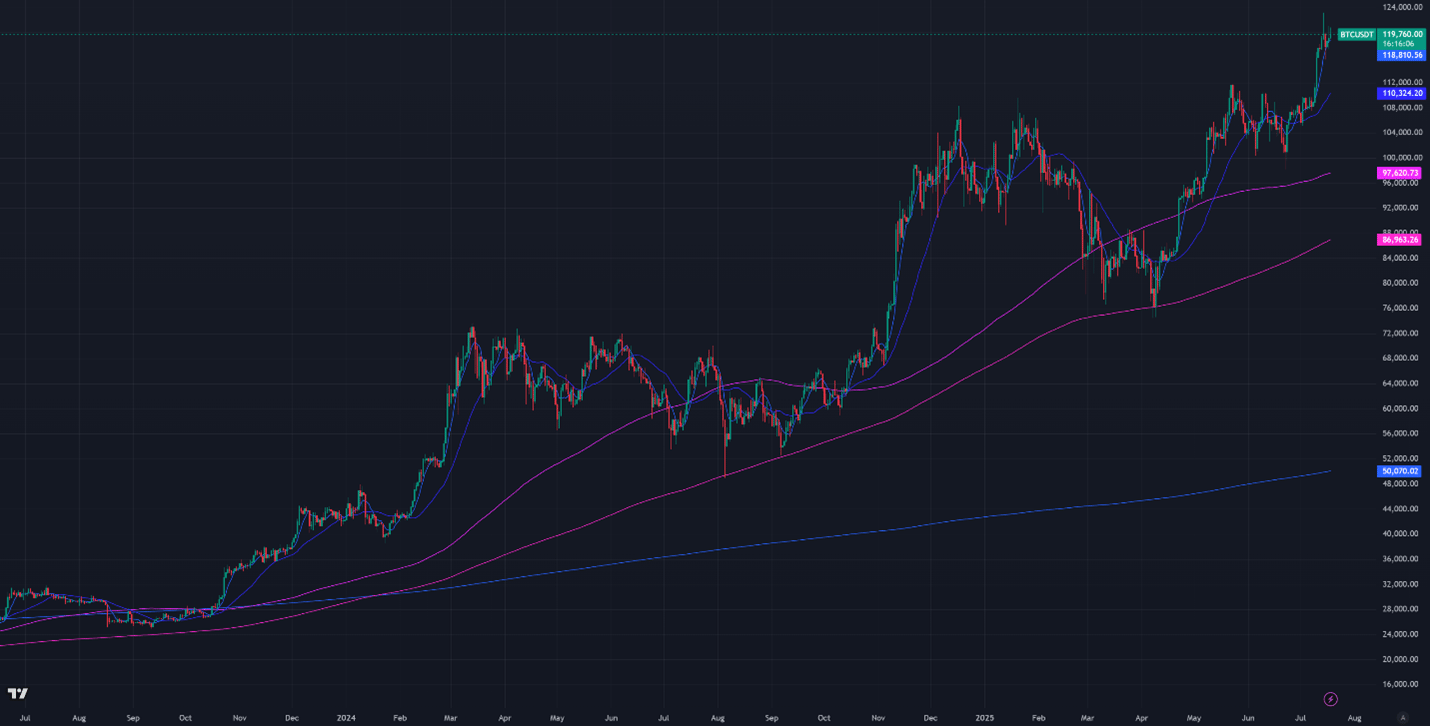
Figure 1: BTC Price, Daily Candles, & Moving Averages; 2 years; Source: Binance
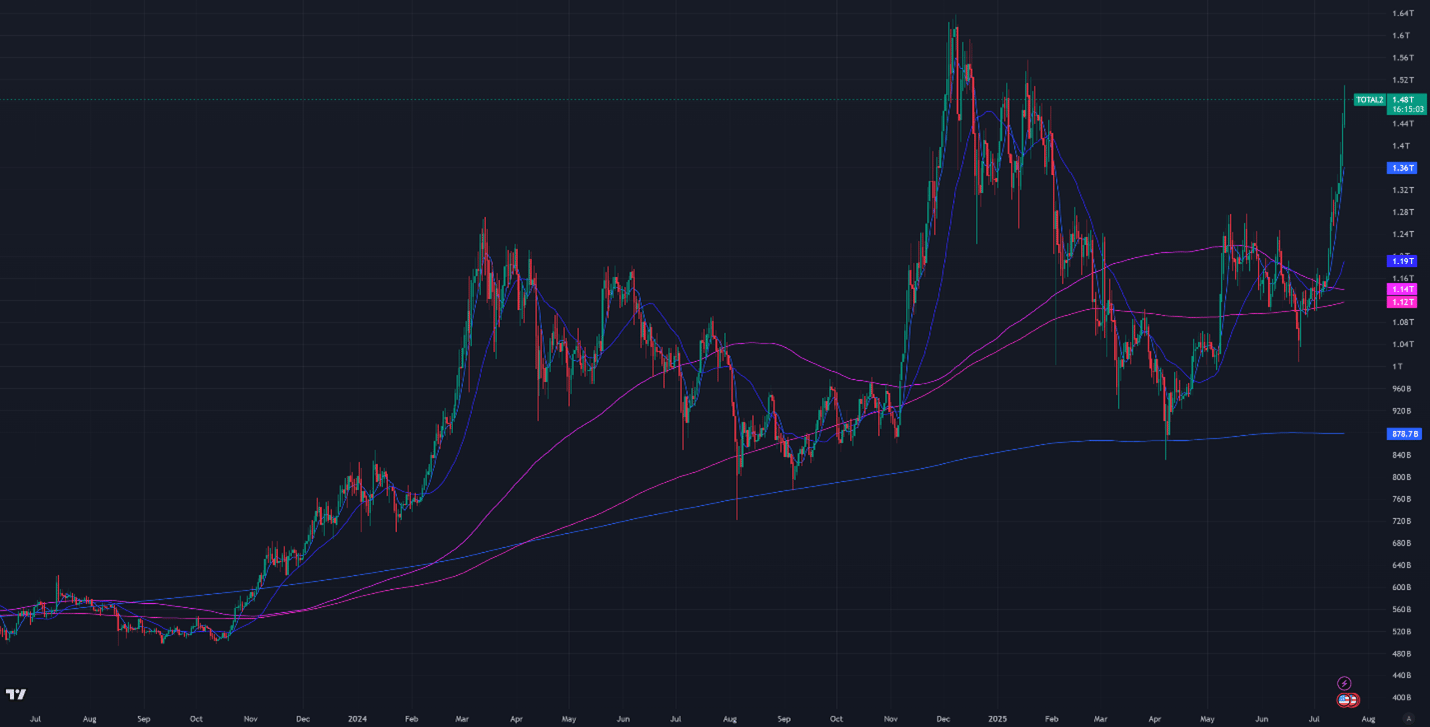
Figure 2: Crypto Market Cap Excluding Bitcoin, Daily Candles, & Moving Averages; 2 years
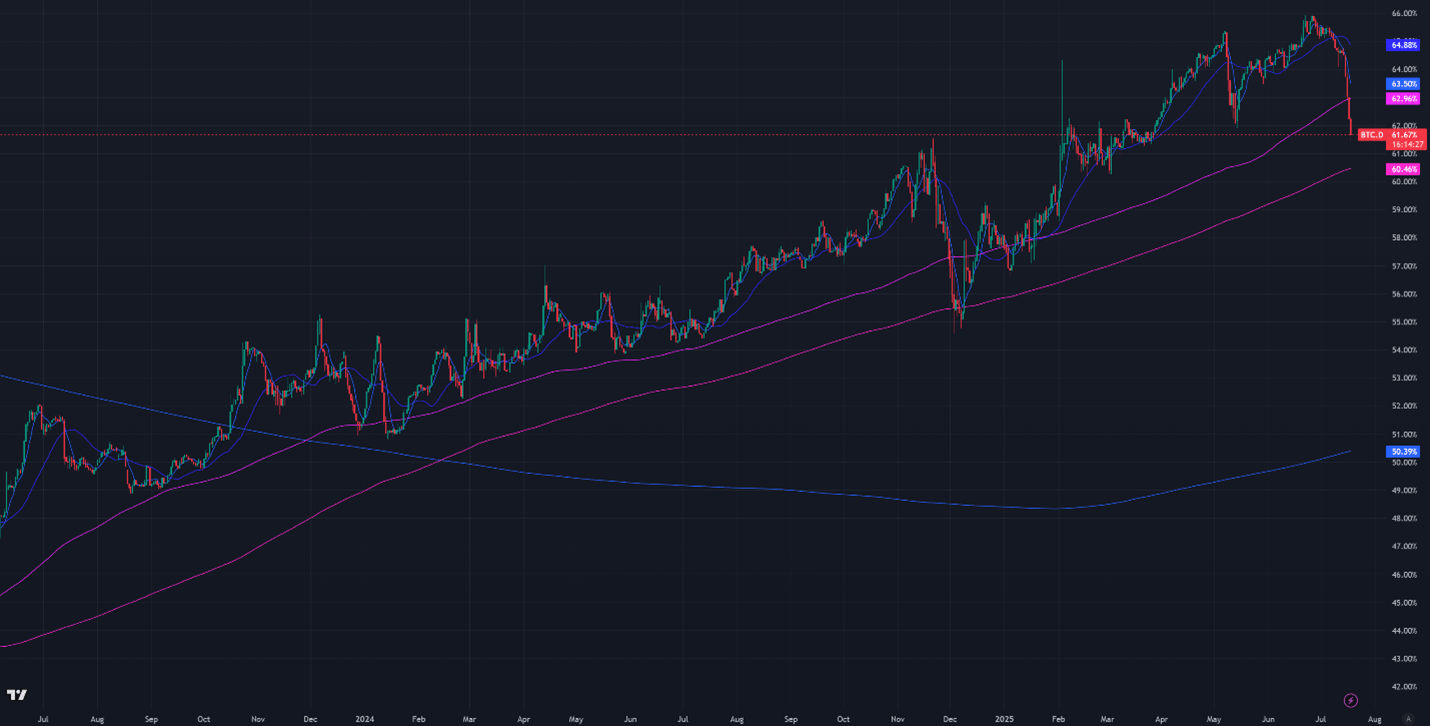
Figure 3: Bitcoin Dominance, Daily Candles, & Moving Averages; 2 years
The moving averages (MA) in Figure 1 are:
Current Price: $119,800
7-Day MA: $118,800
30-Day MA: $110,300
180-Day MA: $97,600
360-Day MA: $87,000
200-Week MA: $50,100
Despite the pause in price movement, Bitcoin remains above all monitored moving averages (MAs). The uptrend remains strong after the high-volume breakout above the previous ATH.
Trend Following
Returns for a Bitcoin 7-day and 30-day long trend-following portfolio are now down just 0.2% from January’s all-time high. These portfolios struggled to capture the failed breakout at $120,000, but are well-positioned to capture further upside.
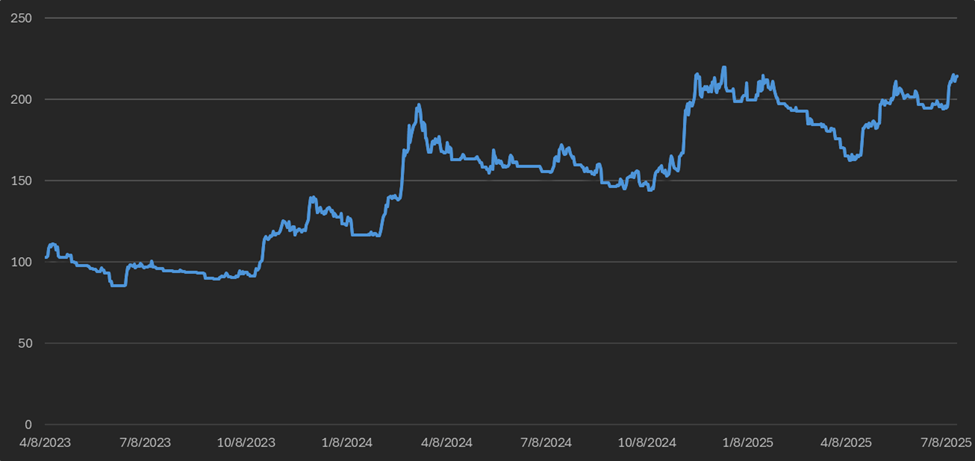
Figure 4: Bitcoin 7 & 30-day Trend Following Strategy Returns
BTC ETF Flows
Strong TradFi demand contributed to Bitcoin ETF inflows reaching the highest level since 2020, despite $3.05B in net outflows.

Figure 5: Bitcoin ETF Flows, Daily Bars; Source: The Block
Volatility
Bitcoin’s implied volatility (DVOL) is currently 39.89%, but reached a low of 36% earlier this month, the lowest level since October 2023. Low implied volatility signals both weak demand for derivatives leverage and market maker complacency.
There has been an emerging trend of selling calls on TradFi Bitcoin products that has put systematic downward pressure on options prices and implied volatility. For example, the YieldMax ETF ($MSTY) sells $4.5 billion in notional call options on Strategy (formerly MicroStrategy) stock on a monthly and quarterly basis. Hundreds of hedge funds execute similar trades on Bitcoin-correlated stocks, such as Bitcoin miners and the numerous Bitcoin ETFs. These call overwriters often sell to market makers, who may sell a similar call on Deribit, locking in a spread. This systematic call would cap DVOL.
This dynamic is favorable for discretionary Deribit options traders, as calls are systematically underpriced relative to the potential realized volatility of the underlying asset. At-the-money calls are particularly cheap.
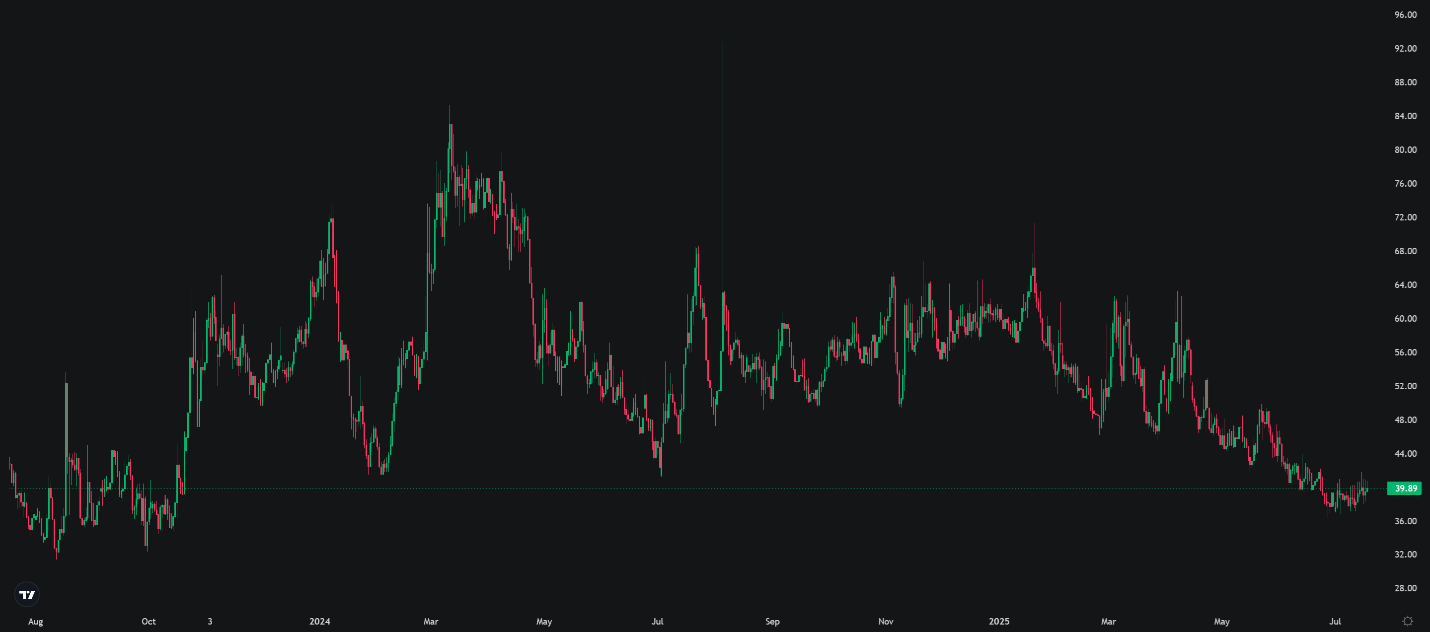
Figure 6: DVOL 2 Years; Bitcoin Index Price; Source: Deribit
Basis Spread
The basis spread, the premium of futures contracts over spot, is positive across all maturities. The average equal-weighted basis spread rose 1.58% APR this week, from 6.77% to 8.34%. However, it's still 0.81% APR (8.81%) below the May 23rd high.
The futures curve is currently in an inverted contango, with the front-month contract (July 25th) yielding the highest APR at 11.62%. Yields then fall into August and flatten through the June 2026 contract at 7.8%. The spread between the highest and lowest yielding maturities is 4.42%. Excluding the volatile front-month, the curve compresses to a 0.67% range.
Deribit’s Bitcoin futures curve is also indirectly suppressed by TradFi call selling, which reduces market maker demand for delta hedging. Futures volume remains ~33% lower than January levels, despite higher spot prices.
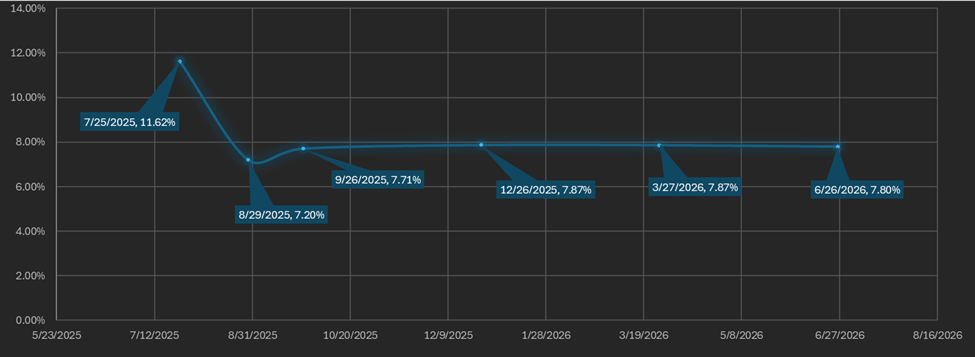
Figure 7: Futures Curve; Maturity Date, APR %
Macro
Market euphoria returned this week despite minimal changes in the broader macro environment. Last week, President Trump signed into law the “Big Beautiful Bill,” which impacts corporate tax structure. Lower corporate taxes increase profitability and can lead to more capital flowing into financial markets via share buybacks and dividends.
This week, the House passed the Digital Asset Market Clarity Act (DAMC) and the GENIUS Act; bills that introduce regulatory frameworks for crypto markets and stablecoin issuers, respectively. While they impose new requirements, they also reduce uncertainty and may facilitate broader participation from institutional investors.
On June 18th, the Federal Reserve held its fourth FOMC meeting of the year. Chair Jerome Powell did not announce any rate cuts or changes to the $5 billion per month quantitative tightening (QT) program set in March. The December SOFR futures market continues to price in a 50 basis point (bp) cut by year-end, unchanged since the tariff announcements earlier this year.
The European Central Bank (ECB) cut rates by another 25 bps on June 6th, making it the second month in a row that the ECB has cut rates. The Swiss National Bank also cut rates by 25 bps to 0% this month, but the Bank of England (BOE) and the People’s Bank of China (PBOC) did not.
The often-cited Bitcoin-M2 money supply correlation (Figure 8) can be attributed to the long-term uptrend in Bitcoin since 2023, but it is not a precise guide for when uptrends begin or end.

Figure 8: M2 Money Supply (Blue), BTC price (Red); 5 years; Source Federal Reserve & Binance
M2 money supply includes physical currency, checking deposits, savings deposits, time deposits, and money market funds. It fluctuates with the level of leverage in the financial system, either through commercial lending by private banks or via Federal Reserve policies like quantitative easing. Since 2022, the Fed has been engaged in quantitative tightening (QT), actively shrinking the M2 supply. This means that any recent increases in M2 are likely driven by growing private sector leverage. High private leverage increases the economy’s exposure to sudden deflationary shocks if borrowers become unable to service their debts.
The Dollar Index ($DXY), which tracks the USD against a basket of foreign currencies, rose to 98.38 as of Thursday evening, up 2.08% from the three-year low set earlier this month.
Historically, $DXY and US treasury bond yields have a strong positive correlation. Figure 9 demonstrates the relationship between the relative strength of the dollar (DXY) and long-term yields.
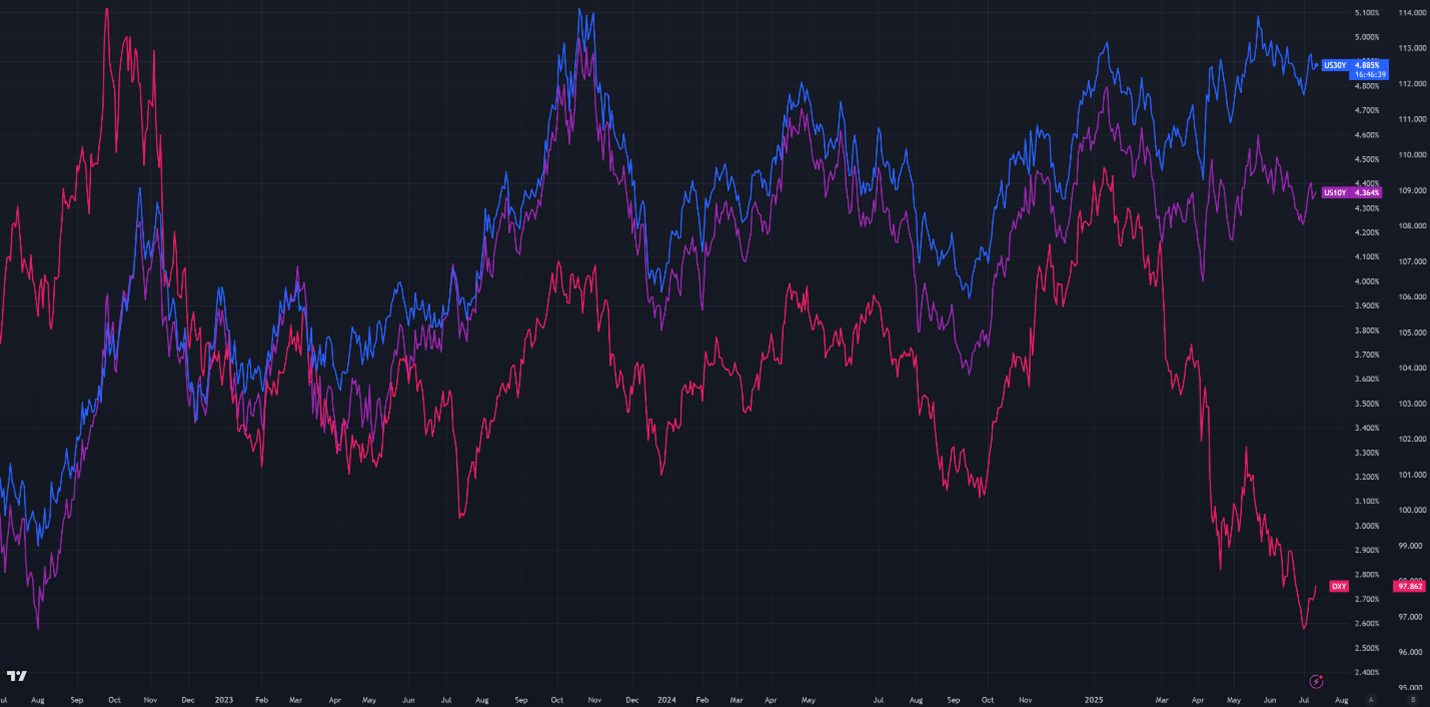
Figure 9: DXY Index returns (Red), 30-year T-Bond yield returns (Blue), and 10-year T-Bond yield returns (Purple), 3 years
Equity market implied volatility (VIX) and U.S. Treasury bond implied volatility (MOVE) remain near long-term averages. The impact of the Middle East conflict on equity volatility was limited; as conflicts cooled, the VIX declined to new lows. As of Thursday, the VIX stands at 16.48, up from 15.77 the previous week, while the MOVE index is at 85.57, up from 81.58.
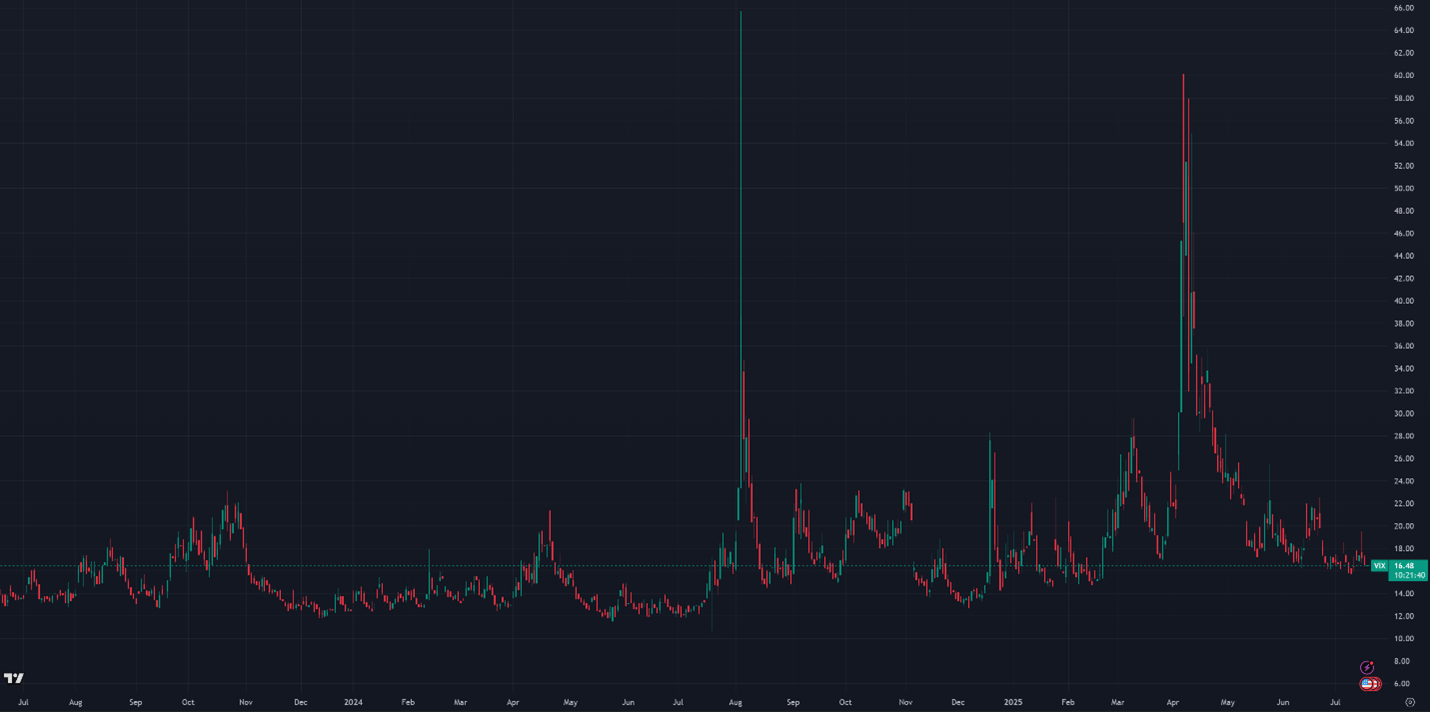
Figure 10: VIX, Daily Candles; 2 Years
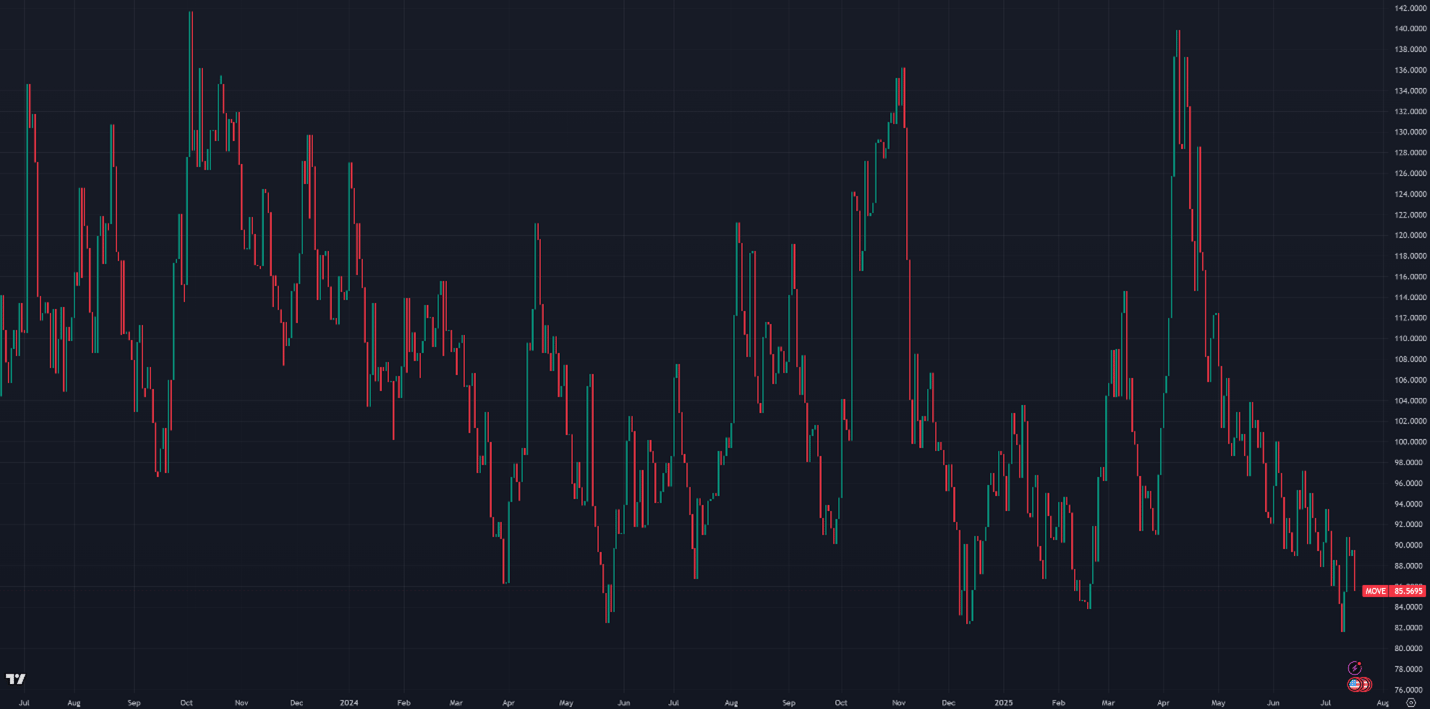
Figure 11: Move Index, Daily Candles; 2 Years
Sincerely,
The Hermetica Team