- Hermetica
- Posts
- Weekly Update - January 9, 2025

IN THIS ISSUE
💸 Earn Like Strategy
🪙 STRC on the Rise
🗞️ One Year. 100% Bitcoin-Backed
💰 USDh Yield Recap
📈 Weekly Market Review
Jakob TL;DR
How do institutions earn on Bitcoin when markets are volatile?
They don’t trade. They structure.
Companies like Strategy treat Bitcoin as a balance-sheet anchor, then build credit and capital around it. Investors earn without directly taking on risks. STRC trading back at par is a clear signal that this model is working.
You can earn the same way on-chain if risk is transparent and individually verifiable (like USDh, which completed 12 out of 12 independent attestations in 2025).
If you want to understand how this playbook works and how to apply it, join me on January 13 at 10:00 ET for a Stacks panel on Yield Strategies & Productive Treasuries.
Earn Like Strategy

Institutions like Strategy are participating in BTC markets differently. They don’t trade in and out, they structure around Bitcoin to run productive treasuries.
It’s possible to participate the same way.
How?
Join Jakob on January 13 at 10:00 ET for a Stacks-hosted panel on Yield Strategies & Productive Treasuries to learn how institutions approach Bitcoin yield and risk.
Apply the institutional playbook and make your BTC productive.
STRC on the Rise

Bitcoin credit is gaining momentum.
Strategy’s STRC perpetual preferred stock has returned to trading at its $100 par value for the first time since November. While a modest headline, it carries larger implications of development of Bitcoin credit as a scalable, institutionally compatible form of Bitcoin exposure.
STRC represents a structural shift in how Bitcoin risk is financed and distributed. Investors don’t need to hold, custody, or manage Bitcoin directly; STRC allows traditional yield-seeking capital to access Bitcoin-linked economics through a senior, income-oriented security. Investors receive a dividend designed to trade near par, while Bitcoin price volatility and balance-sheet risk are absorbed at the issuer level.
Now consider a STRC-backed Bitcoin yield product built to institutional standards; sustainable yield from Bitcoin, delivered through TradFi-grade infrastructure, with transparency and on-chain governance.
Maybe you’ll hear more from us on the topic soon…
One Year. 100% Bitcoin-Backed

12 months. 12 attestations.
All year long, USDh’s BTC reserves were secured off-exchange and independently verified by Copper and Ceffu.
In summary, as of the snapshot time:
USDh supply: $5,835,521.21
Copper custodied assets: $3,546,476.30
Ceffu custodied assets: $2,205,972.03
Redeeming Reserve Stacks: $82,692.79
Redeeming Reserve Ethereum: $5,817.11
Minting Wallet: $0.00
Total backing assets: $5,840,958.24
Reserve Fund: $78,493.86
USDC: $75,148.12
USDh: $3,345.74
Total % of USDh: 101.38%
See the full breakdown of USDh’s backing in the published attestations. The same level of transparency carries into the year ahead.
USDh Yield Recap

That high?
Yes.
Week 2 delivered 13% APY.
Market Review
Bitcoin remains range-bound between $84,000 and $94,000. Over the same period, Deribit implied volatility continued to decline in line with realized volatility. A brief uptick in implied volatility occurred earlier in the week as prices approached $94,000, but this proved short-lived and volatility has since reset to recent lows. Implied volatility peaked at 46.39% on Monday, but has since declined four points to 41.75%.
The S&P 500 reclaimed all-time highs the day after Christmas for the first time since September and has continued to increase since. In contrast, technology stocks remain weaker, with the NASDAQ recording its fourth consecutive lower high since peaking on October 29. Notably, both the NASDAQ and Bitcoin are exhibiting similar price patterns.
The tech and AI-driven rally that began after the April lows has slowed. Strength remains concentrated in select areas of the AI market segment, particularly memory chips, where supply constraints persist for next-generation AI-focused GPUs.
Data Summary:
DVOL: 41.75%
Equal-weighted futures basis spread: 5.31% APR
Futures curve is in an inverted contango from front week onward
Perp funding rates are down compared to last week
Aggregated Altcoin market caps rose from $1.21T to $1.25T, peaking at $1.32T
Bitcoin dominance fell 0.44%
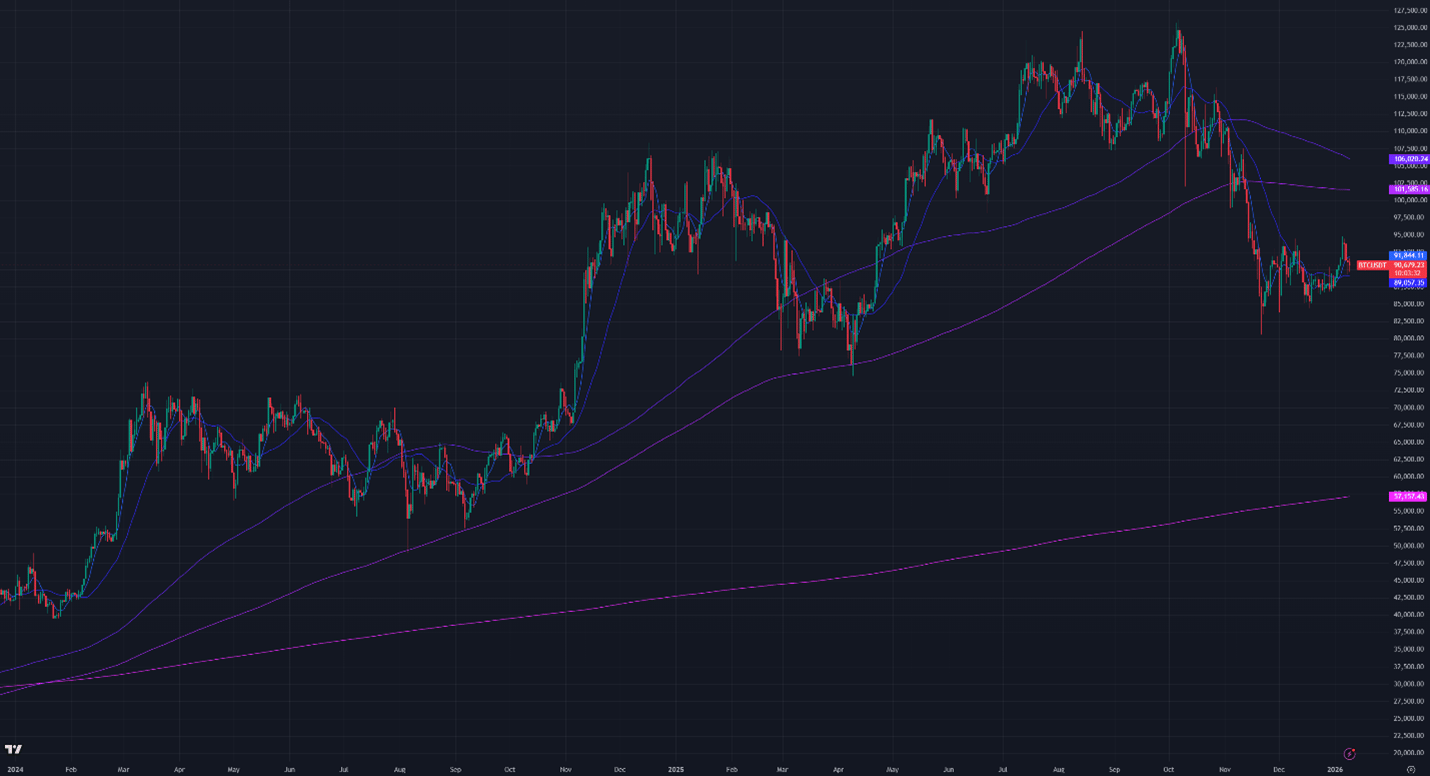
Figure 1: BTC Price, Daily Candles, & Moving Averages; 2 years; Source: Binance
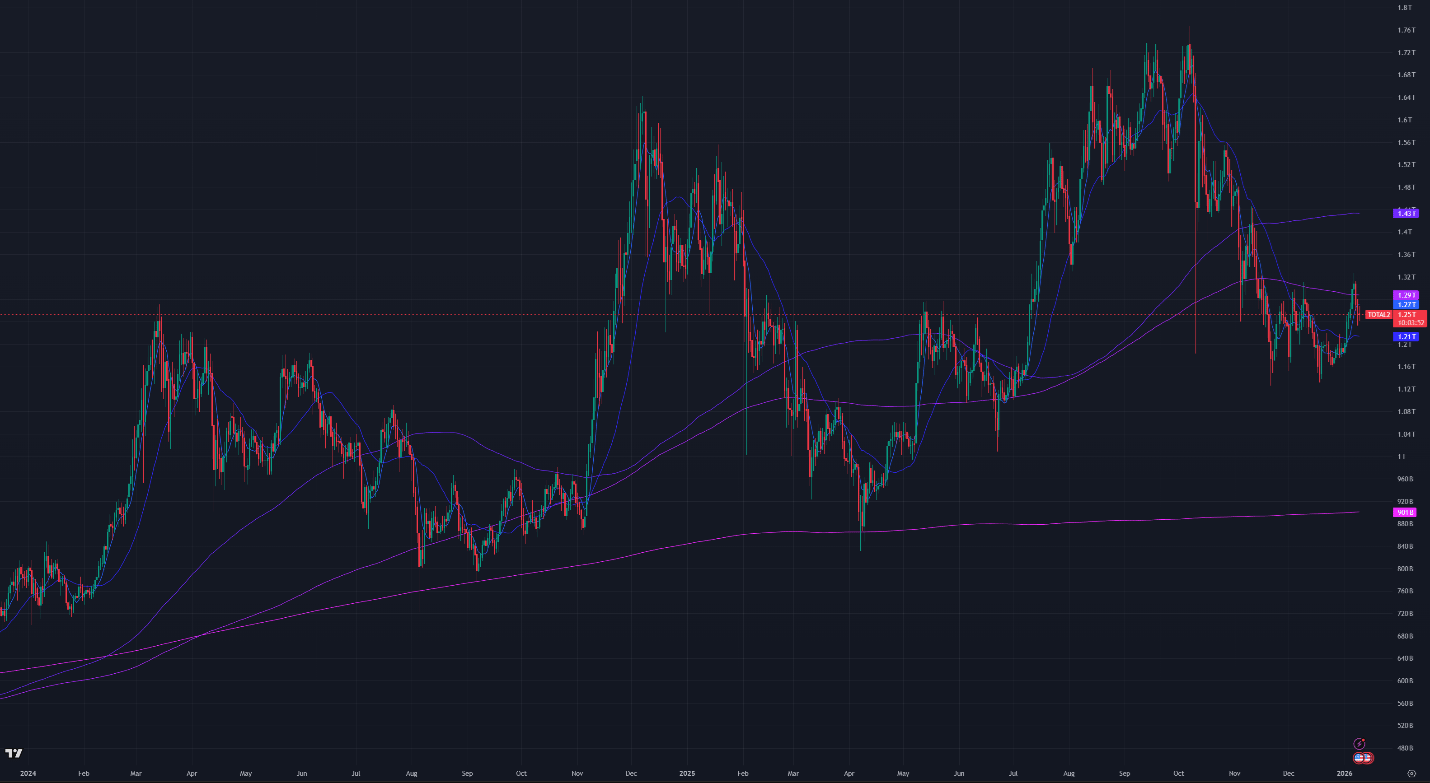
Figure 2: Crypto Market Cap Excluding Bitcoin, Daily Candles, & Moving Averages; 2 years
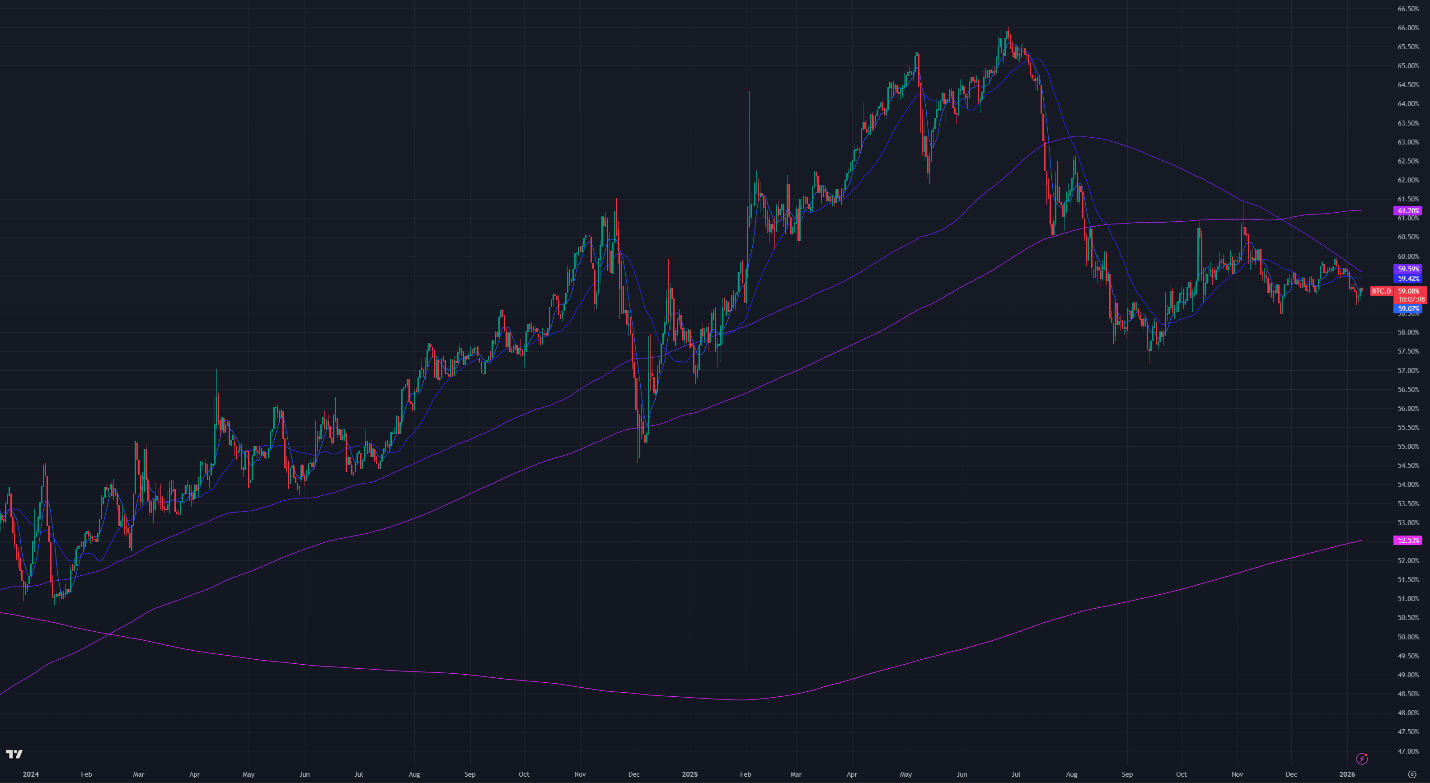
Figure 3: Bitcoin Dominance, Daily Candles, & Moving Averages; 2 years
The moving averages (MA) in Figure 1 are:
Current Price: $90,700
7-Day MA: $91,800
30-Day MA: $89,000
180-Day MA: $106,000
360-Day MA: $101,600
200-Week MA: $57,200
Bitcoin is trading near both short-term moving averages, the 7-day and 30-day MAs. Price is no longer in a strong downtrend but remains below the longer-term 180-day and 360-day MAs, leaving the broader trend unresolved.
The current price near $90,700 is within a technical support zone. Below this area, support levels are at $86,000, $80,000, $76,000, and $60,000, with the long-term 200-week MA near $56,000 historically marking cycle bottoms.
BTC ETF Flows
Net outflows totaled $40M this week. Since Thanksgiving, fund flows have moderated significantly, shifting from multi-billion-dollar weekly outflows to much smaller movements, with both inflows and outflows now measured in the low hundreds of millions. As flows stabilized into year-end, realized volatility declined. While daily flows have picked up in the new year, they remain broadly balanced on a weekly basis.

Figure 4: Bitcoin ETF Flows, Daily Bars; Source: The Block
Volatility
Bitcoin’s implied volatility (DVOL) continued to decline through the holiday period, with DVOL currently at 41.75%, down from 42.4% last week. Since the October selloff, volatility has remained range-bound between the low-40% and low-50% levels. Prior to the holiday weeks, price action below $90,000 was consistently accompanied by implied volatility rising above 50%. More recently, however, implied volatility has remained capped below that threshold. This week, implied volatility briefly increased as price approached the $94,000 level.
Implied volatility reached a two-year low in late September, but market declines in October and November reduced options liquidity and temporarily interrupted the year-and-a-half downtrend. Volatility has since resumed its broader decline, driven in part by market-maker options hedging across Bitcoin-linked products such as ETFs, Bitcoin treasury companies, and miners, which systematically compress implied volatility.

Figure 5: DVOL 2 Years; Bitcoin Index Price; Source: Deribit
Basis Spread
The basis spread, or the price of the futures contract over its spot price, is positive across all maturities. The average (equal-weighted) annualized basis increased week over week, rising from 4.67% to 5.31% APR.
The futures curve is in flat contango, with the front month (January 30) trading in line with the back month and later maturities. The spread between the lowest and highest yielding contracts fell from 1.36% to 0.99%, driven by larger increases in longer-dated maturities relative to shorter ones.

Figure 6: Futures Curve; Maturity Date, APR %
Macro
On December 10th Federal Reserve held its 8th FOMC meeting of the year, where Fed Chairman Jerome Powell decided to lower the federal funds rate (FFR) by 25 bps to 3.50%-3.75%. The Fed’s next meeting is scheduled for January 27.
Until broader macro data points emerge, recent U.S. macro developments have been influenced by several high-profile policy actions. Discussions with major oil companies and trading houses are underway regarding Venezuelan crude exports, but structural challenges in Venezuela’s oil sector persist.
Domestically, the U.S. administration announced proposals to cap executive compensation on defense contracts at $5M and restrict dividends and share buybacks. Around the same time, a proposal was announced to increase the U.S. defense budget to $1.5T, a 50% increase from the current $1T budget. Separately, proposals to limit large institutional purchases of single-family homes and to direct significant Treasury purchases of mortgage-backed securities were also discussed publicly.
These announcements produced sharp but offsetting market reactions. Defense contractor stocks sold off following the initial compensation proposal, but later recovered. A similar pattern occurred in large commercial real estate investment firms.
Sincerely,
The Hermetica Team