- Hermetica
- Posts
- Weekly Update - January 31, 2025
Weekly Update - January 31, 2025
Largest Stable on Stacks
IN THIS ISSUE
📰 USDh fully backed by Bitcoin
💸 USDh liquidity
💭 Improve your experience
💰 USDh yield recap
☎️ Hermetica Hangout: Granite
📈 Weekly market review
Like what you see? Join our exclusive, ever-growing community on Discord and take part in future product launches:
USDh Fully Backed by Bitcoin

To enhance transparency, we've released attestation reports from Copper and Ceffu verifying that all assets backing USDh are securely held off-exchange in institutional-grade custodians.
We’ll release monthly attestation reports moving forward for ongoing verification of USDh’s reserve assets, so you can ensure that every token in circulation is fully backed by Bitcoin.
USDh Liquidity
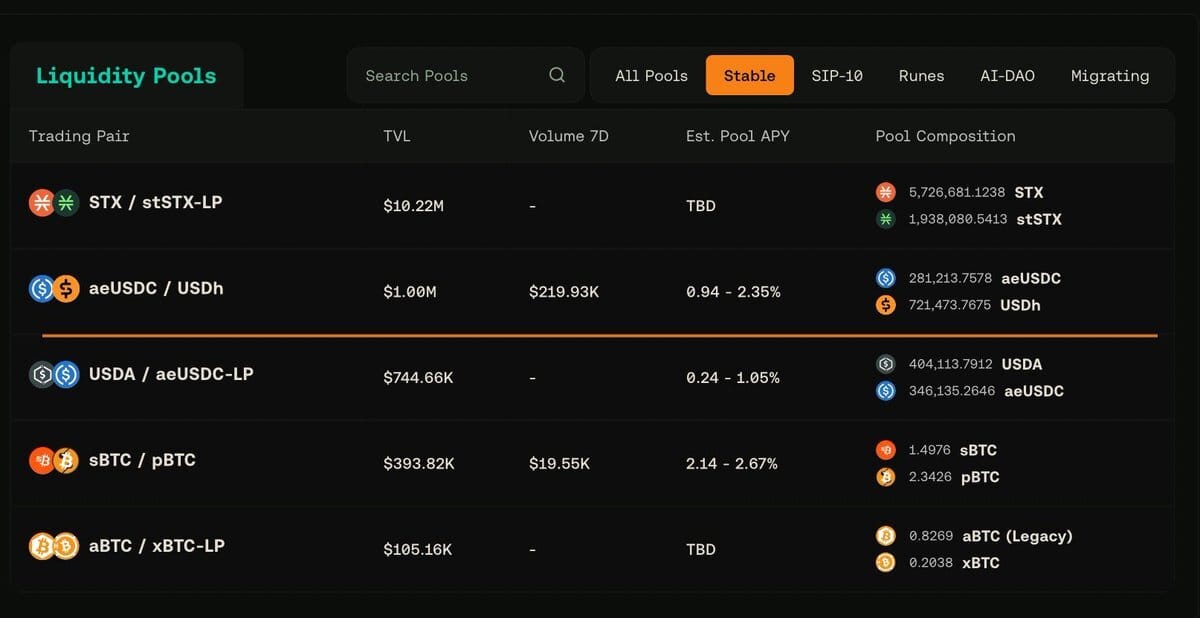
The USDh/aeUSDC pool on Bitflow is now the biggest stablecoin pool on Stacks, with $1 million in liquidity.
More liquidity means lower slippage, even for large trades. By providing liquidity, you earn 1.10% from Bitflow plus 30x Hermetica points.
Improve Your Experience

We value your opinion and want to hear your thoughts. Take a moment to fill out our feedback form and help us improve.
Your insights will directly influence how we build and refine Hermetica.
Share your thoughts now - it only takes a few minutes!
USDh Yield Recap
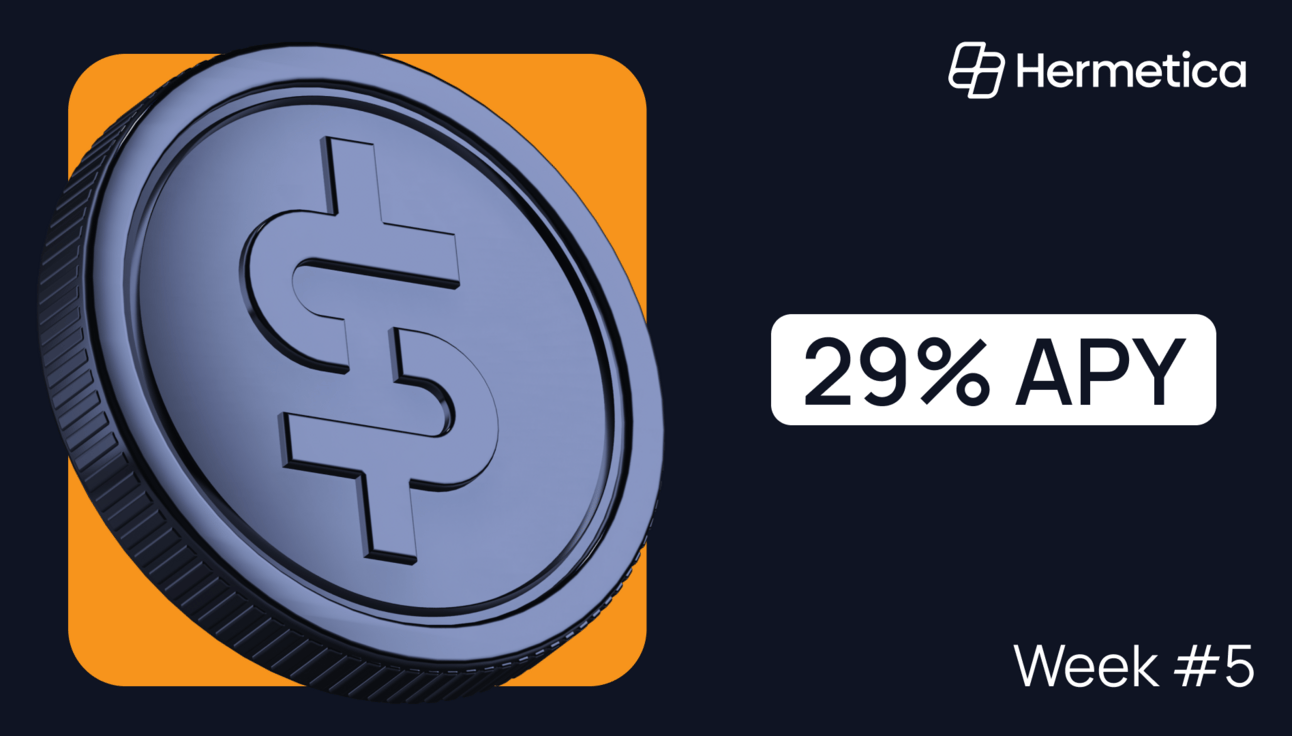
If you staked USDh this week, you’re smiling. If you didn’t, you’re probably checking the APY right now.
29% APY for week #5. Don’t just watch, get in on the action.
Hermetica Hangout: Granite

This week we hosted Blaize, Founding Contributor from Granite, to talk what they’re building and how USDh can unlock Bitcoin DeFi. Take a listen, if you haven’t already.
Next week we’re bringing on visions.btc from Velar to share insights on the .btc movement and what’s next for Velar and USDh.
Set your reminder and join the discussion. Follow the Hermetica X account to stay in the loop.
Market Review
At $104,782, Bitcoin’s price remains largely unchanged from last Thursday’s close, up just 0.69%. However, intraweek volatility was elevated, with Bitcoin dipping to $97,800 on Monday during the Nvidia selloff and reaching $106,500 yesterday, 24 hours after the Fed’s January meeting.
Altcoins underperformed Bitcoin this week, down 1.76%. In the two weeks prior, they had outperformed following a New York Post article suggesting that the U.S. government's Bitcoin Strategic Reserve (BSR) might include U.S.-based altcoins. This speculation was confirmed last Thursday when President Trump signed an executive order establishing a working group to explore a Digital Asset Stockpile (DAS). The order also recommended that future Bitcoin or crypto asset seizures be held in the DAS. The announcement initially fueled a broad crypto rally, but apart from Bitcoin and Solana, most altcoins remain well below recent highs.
Currently, the aggregated altcoin market cap is in a 12.88% drawdown from all-time highs (ATHs), compared to Bitcoin’s 4.39% decline.
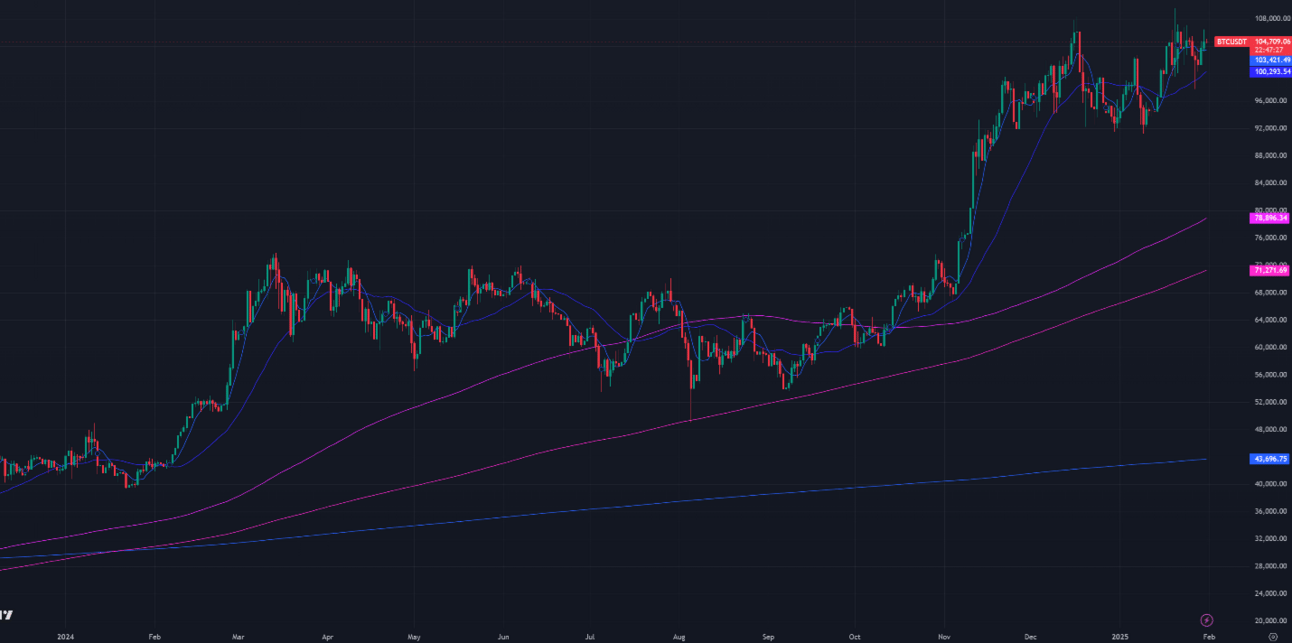
[Figure 1: BTC Price, Daily Candles & Moving Averages; 1 year; Source: Binance]
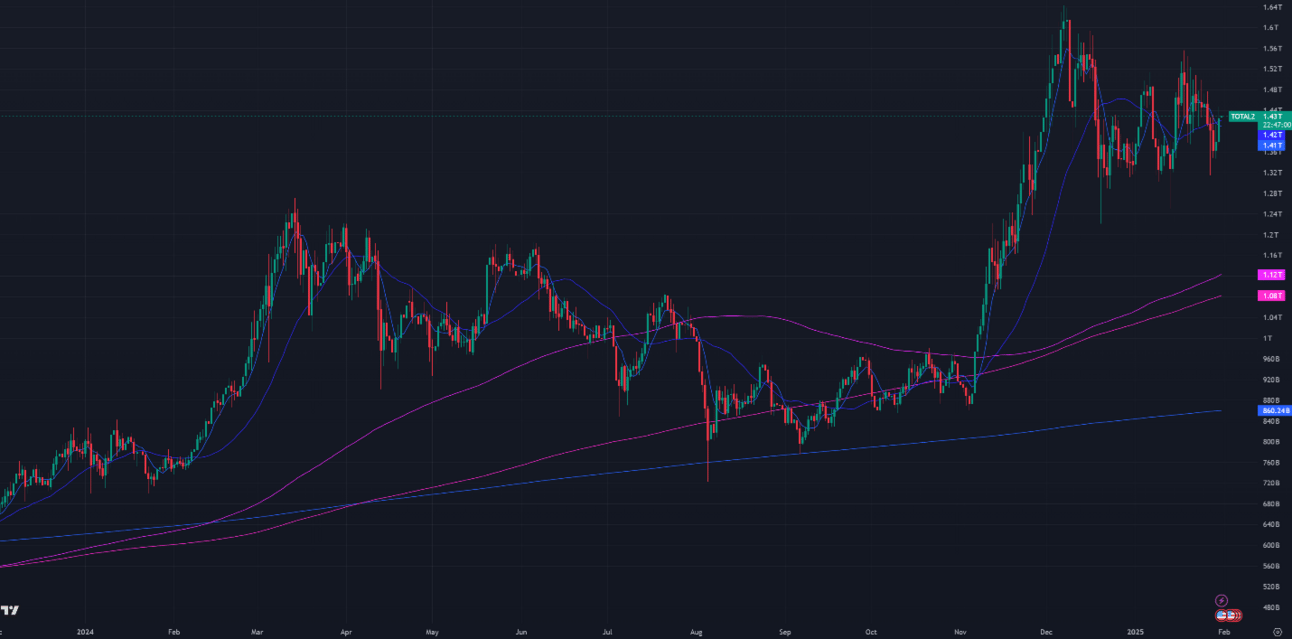
[Figure 2: Crypto Market Cap Excluding Bitcoin & Moving Averages, Daily Candles; 1 year]
The moving averages (MA) in Figure 1 are:
7-Day MA: $103,421
30-Day MA: $100,294
180-Day MA: $78,896
360-Day MA: $71,272
200-Week MA: $43,697
Price is trading above all moving averages (MAs) and approaching price discovery. Bullish momentum strengthened two weeks ago when the 7-day MA crossed above the 30-day MA for the first time since this short bear phase began seven weeks ago. As long as price holds above these MAs, the uptrend remains intact. During pullbacks, the MAs will act as support, as seen with the 30-day MA on Monday.
Key downside levels for Bitcoin to watch include $104,000, $101,000, $98,000, $94,000, $92,500, $90,000, $89,000, $88,000, $74,000, $72,000, $70,000, or $68,000. On the upside, levels are $106,000, $108,000, 109,500.
The Bitcoin returns are as follows:
1 month: 11.02%
3 months: 51.20%
6 months: 80.64%
12 months: 143.29%
Bitcoin's trailing 1-year return stands at 143.29%, nearly three times its 56% average annual return since 2015. Assuming no further rally, elevated returns should persist through February 2025.
Historically, above-average returns are followed by periods of below-average performance, and vice versa. Bitcoin saw a gradual downtrend from the BTC ETF launch (Q1 2024) until Trump’s reelection (Nov 5, 2024). While high returns alone don’t signal a market top, they can help identify long-term peaks or troughs when combined with other metrics.
BTC ETF Flows
Net BTC ETF inflows since Friday total $758.6M, with last week’s $2.313B marking the highest since November 2024. This week saw a large outflow on Monday due to Nvidia’s crash, but net inflows remain strong. Weekly net inflows are still high relative to historical levels, but without that dip, weekly inflows would have exceeded $1B.

[Figure 3: Bitcoin ETF Flows, Daily Bars; Source: The Block]
Volatility
Bitcoin's implied volatility (DVOL) is at 54.57%, placing it in the 25.9th percentile relative to the past year. For the last four months, DVOL has ranged between 55% and 65%, now sitting at the bottom of this range. It briefly spiked to new highs on Inauguration Day and again during Monday’s Nvidia-led market crash, but has since declined.
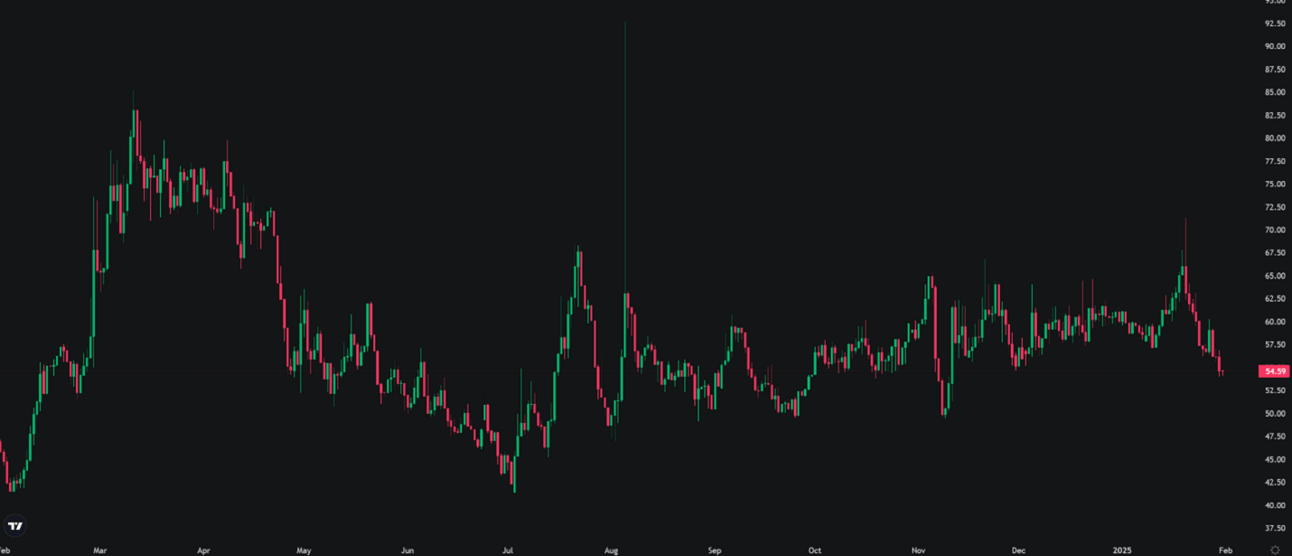
[Figure 4: Aggregated Bitcoin Liquidations, 4-hour intervals; Bitcoin Index Price; Source: Coinglass]
On Monday, the Nvidia selloff triggered a broader crash in crypto markets, despite no direct impact from Deepseek or Nvidia’s valuation on cryptocurrency fundamentals. Market downturns like this are often driven not by intrinsic value shifts but by liquidity pressures and correlation-based trading strategies.
Market crashes tend to spill over across assets due to the multi-asset nature of most portfolios. Many traders holding Nvidia stock also have BTC spot ETFs, and when Nvidia experiences a sharp selloff, these investors may be forced to liquidate other holdings—including Bitcoin—to cover margin calls or mitigate risk exposure.
This process is reinforced by correlation arbitrage traders, typically high-frequency quant firms that bet on asset price relationships remaining stable. When Nvidia declines but Bitcoin hasn’t yet reacted, these firms may short BTC spot ETFs while buying Nvidia stock, anticipating that overleveraged traders will be forced to sell Bitcoin as well. This cycle of forced liquidations and arbitrage-driven selling accelerates downside momentum.
The severity of Monday’s drop was also magnified by market fragility in the preceding week. Bitcoin’s realized volatility had been steadily declining, as evidenced by lower local market tops and higher local market lows, forming a compression pattern on the charts.
This volatility compression often reflects trader complacency and reduced activity, leaving the market vulnerable to sudden moves. Since Trump’s inauguration on January 20 and his executive order establishing a digital asset stockpile task force, Bitcoin trading volumes had been in decline. This lower liquidity meant that during the Nvidia-driven selloff, crypto markets had less depth to absorb the shock, amplifying the overall price reaction.
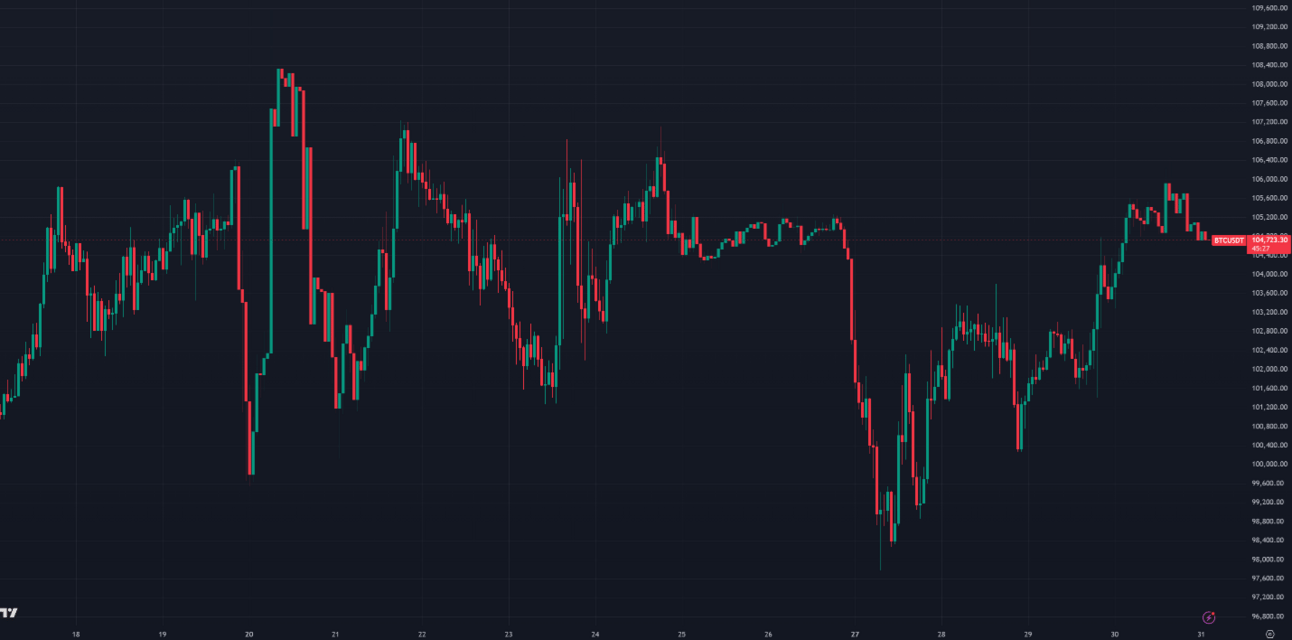
[Figure 5: BTC Price, Hourly Candles; 2 Weeks; Source: Binance]
Basis Spread
The basis spread, or the price of a futures contract over its spot price, is positive across all maturities. This week, the average basis spread declined to 10.77% APR, down from 11.23% APR last week. As January comes to a close, the basis spread is 3.74% APR lower than where it started the month, but has remained within a tight range of 10.77% to 14.51% APR throughout.

[Figure 6: Futures APR % over spot price 1 month; Source: Deribit]
The futures curve is in a normal contango from the front month contract (February 28th) onward. The futures curve is relatively flat across the whole curve with the front month (February 28th) and back month (March 28th) contracts being below all later maturities. The front week maturity (February 7th) APR is volatile due to being so close to maturity and is therefore out of sync with the rest of the contracts. There is a 0.91% spread between the lowest and highest yielding maturities, up from 0.81% last week. Bitcoin’s flat futures curve over the past two weeks suggests a balanced market between spot and perpetual trading, with neither strong buying nor selling pressure dominating.
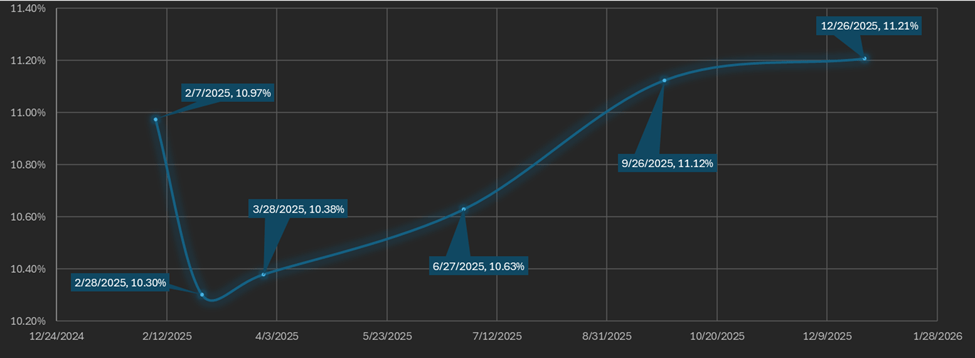
[Figure 7: Futures Curve; Maturity Date, APR %]
The current futures curve is neutral relative to recent weeks. The future curve from two weeks ago (Figure 8) was in a steep downward sloping contango which indicates that demand for closer maturities was outstripping supply and becoming detached from Bitcoin’s long run APR. This occurs because market makers use the front month futures to hedge short perp and spot positions during periods of high long demand. The greater the detachment of short-term maturities from the broader curve, the more bullish the market sentiment toward near-term price action.
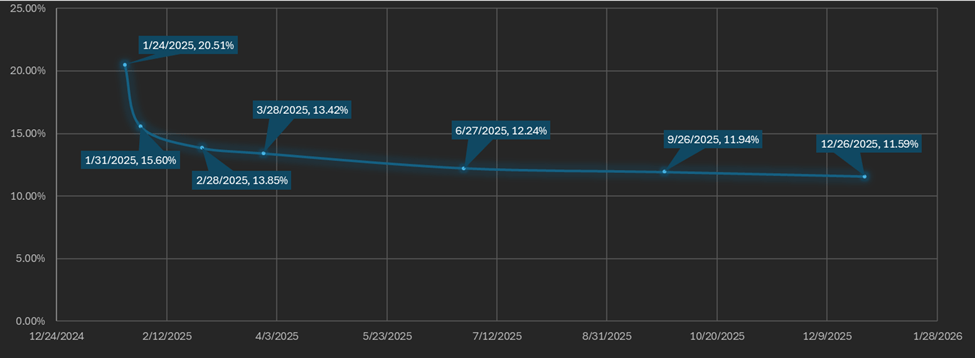
[Figure 8: Futures Curve Bullish Example; Maturity Date, APR %]
Macro
On Wednesday, January 29th, 2025, the Federal Reserve held its first FOMC meeting of the year, where Chairman Jerome Powell paused rate cuts but signaled a dovish outlook for potential cuts later in the year. Powell reassured markets that the Fed has no intention to raise rates in 2025, easing concerns that rates might rise after the hawkish guidance from December’s meeting. The dovish rhetoric from January has calmed fears of rate hikes this year, with the Fed expected to maintain a pause for a few more meetings before making a cut. The Fed’s intentions regarding rate changes will be guided by economic data leading up to their next meeting.
In response to the FOMC press conference, asset markets experienced a modest rally. Equity markets gained 1.2%, while gold and crypto markets performed even better, up 1.7% and 5.3%, respectively, as of this writing.
Market implied volatility has normalized since the volatility shock in December’s FOMC meeting. There were two mild volatility shocks since then—January 13th (Inauguration Day) and January 25th (17% drop in Nvidia stock). These small, periodic shocks are typical and not indicative of broader market distress.
After the December FOMC meeting, 30-year Treasury bond yields rose by 16%, from 4.31% to a peak of 4.97%. Since January 10th, the day before Trump’s inauguration, rates have declined to 4.76%, still elevated from December’s levels but trending downward due to the dovish tone from the January meeting.
Both equity implied volatility (VIX) and Treasury bond implied volatility (MOVE) have dropped since the FOMC meeting, now standing at 15.83 and 90.54, respectively.
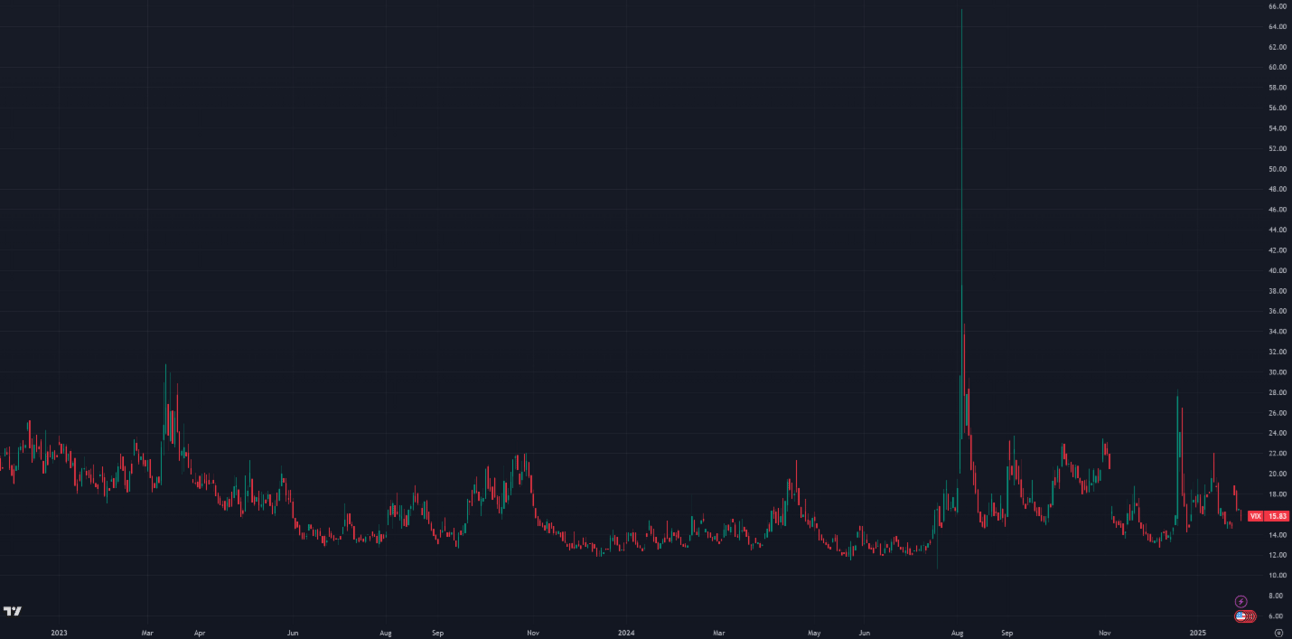
[Figure 9: VIX, Daily Candles; 2 Year]
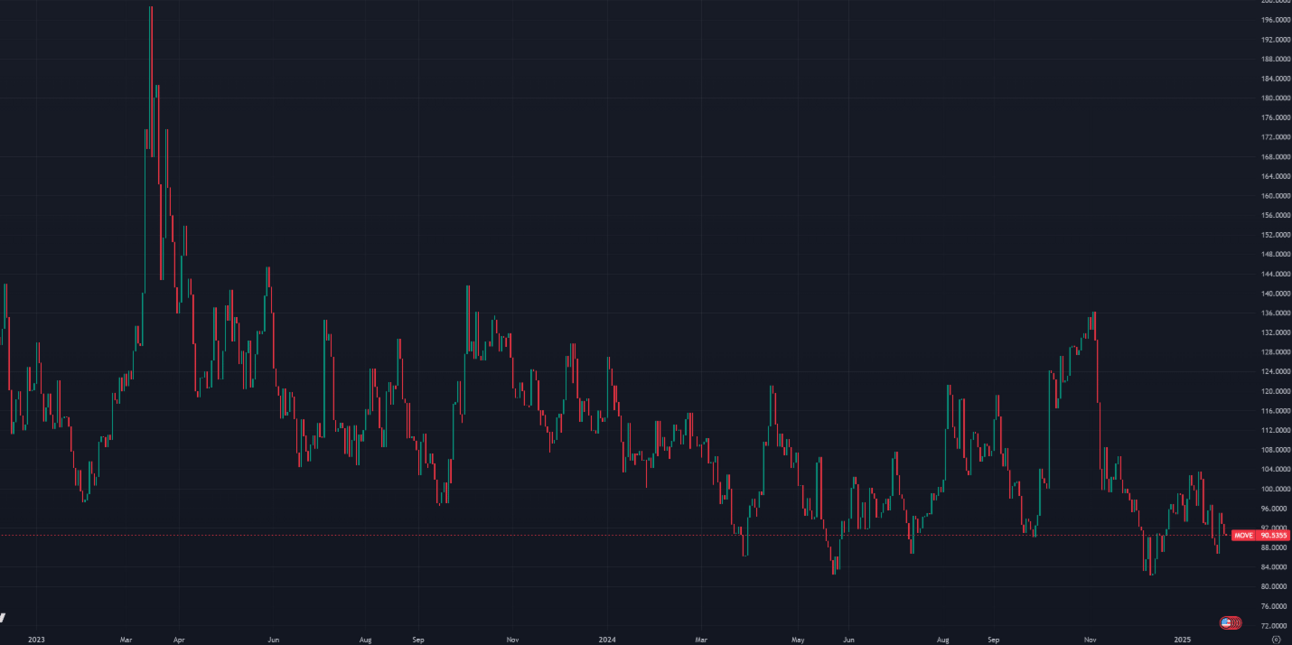
[Figure 10: Move Index, Daily Candles; 2 Years]
Sincerely,
The Hermetica Team