- Hermetica
- Posts
- Weekly Update - December 5, 2025

IN THIS ISSUE
🏦 Strategy is the Prototype
🤖 The 2025 State of AI
💰 USDh Yield Recap
📈 Weekly Market Review
Jakob TL;DR
What does it say when a company with 650,000 BTC and a $1.44B USD reserve is basically an off-chain prototype of the BTCfi protocols we’ll run transparently on-chain?
Messari’s 2025 AI report just confirmed what’s already obvious to anyone paying attention. AI is now at over 700M weekly users, and it is still early in its curve. To me, it's a basic truth; AI is becoming the base layer of productivity across every industry. You either learn how to work with it and compound your output, or you fall behind.
Strategy is the Prototype
Strategy’s latest move is clear: the “HODL company” era is over, and the “Bitcoin monetary policy” era has begun.
Strategy added $1.44B USD reserve on top of its 650K BTC holdings to support dividend payments and debt servicing. Strategy is managing liquidity, distributions, and credit risk like a bank for a listed BTC vehicle.
An off-chain approach to a simple idea: Use BTC as core collateral to earn more BTC.
Bitcoin DeFi can do this on-chain.
On-chain, the same economics become transparent: BTC collateral and automated payout policies governed by code, accessible to anyone.
Strategy is the TradFi prototype.
We’re building the on-chain Strategy with the same thesis: Bitcoin as the hardest collateral, finally earning without the black box.
The 2025 State of AI
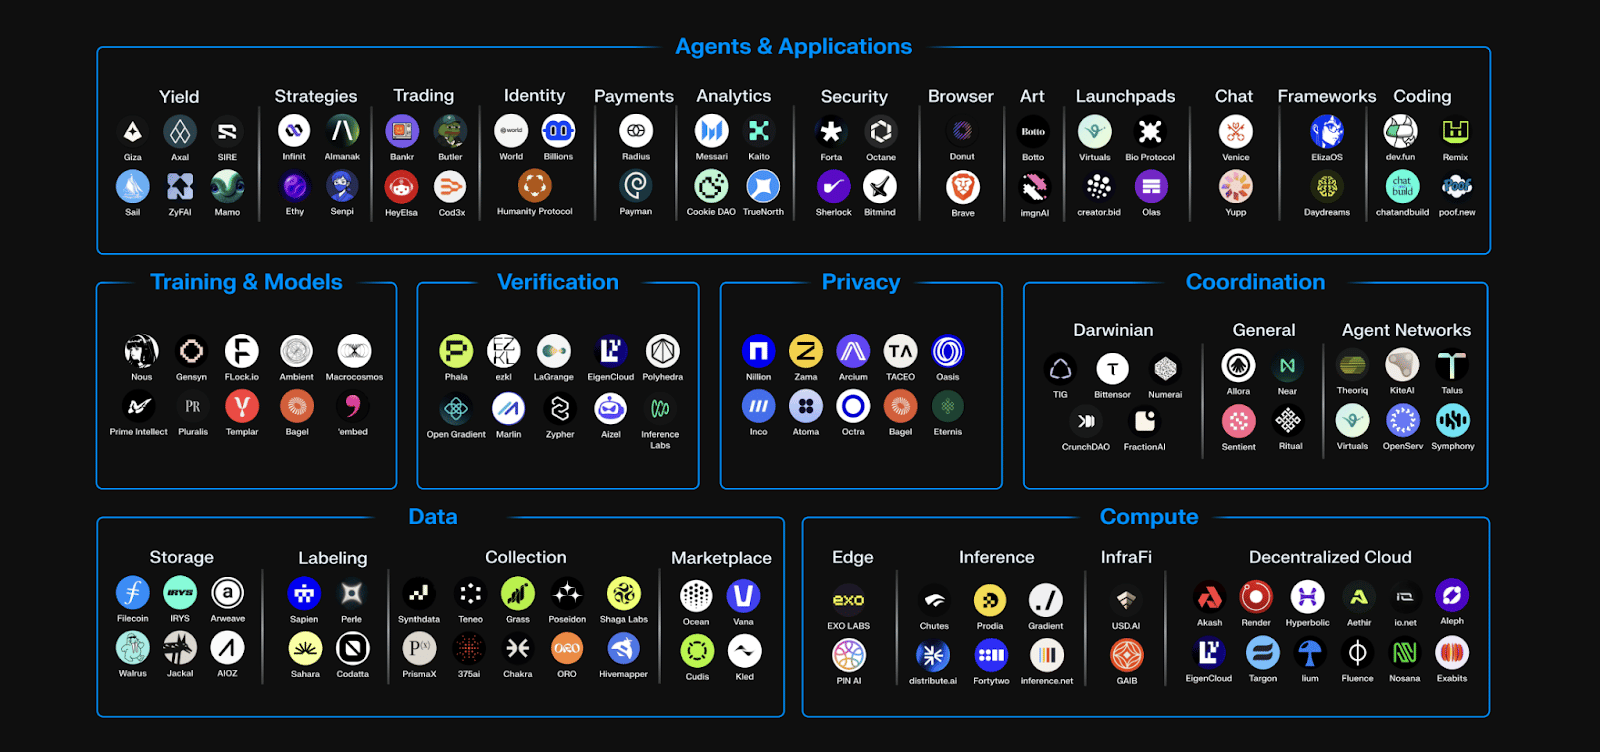
AI adoption continues to accelerate across every major industry in 2025. Usage has reached over 700M weekly users, governments are launching national “sovereign AI” strategies. AI computing spend is now projected to exceed $2.8T by 2029.
This growth has a physical footprint. AI data centers consumed ~415 TWh (≈1.5%) of global electricity in 2024; forecasts suggest ~2% in 2025 and a potential doubling by 2030. A single frontier model training run is projected to require 1–2 gigawatts of power by 2028, and over 4 gigawatts by 2030.
Energy is the primary constraint on AI scale.
Bitcoin is the purest form of energy money, digital scarcity secured by machines. If AI optimizes for survival and efficiency, it gravitates toward Bitcoin.
AI adoption could be the biggest driver of Bitcoin adoption.
USDh Yield Recap
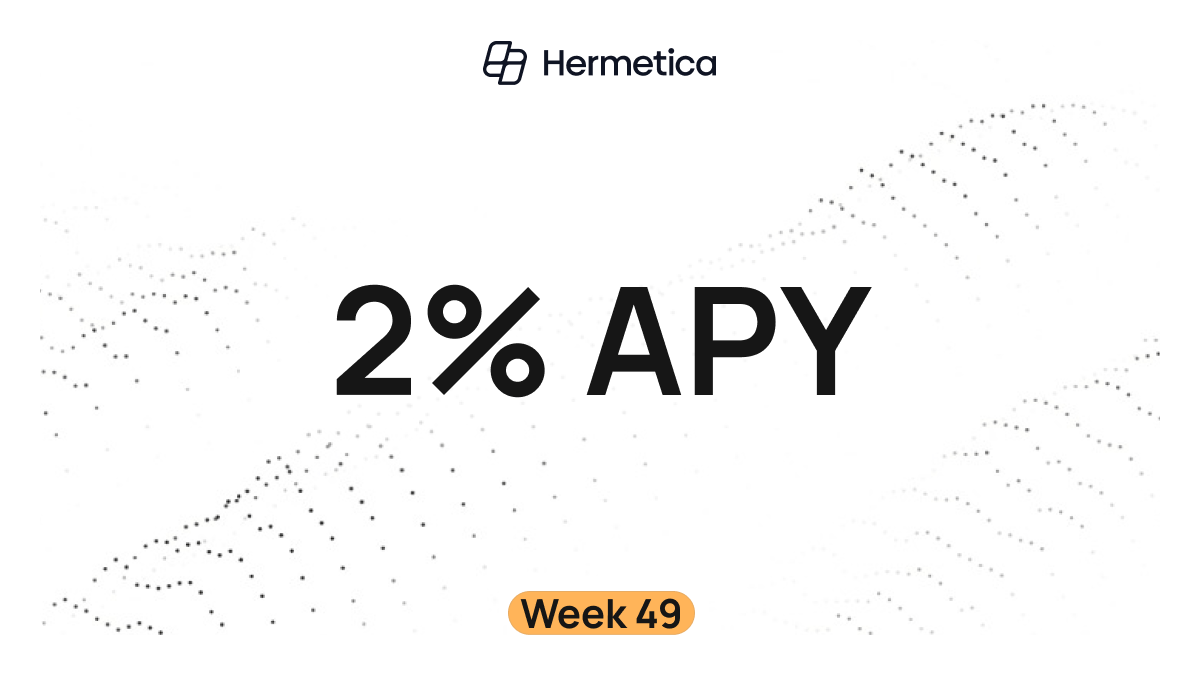
Your on-chain savings account delivered 2% APY this week.
Market Review
Bitcoin continues to recover and now trades just under $92,000, up from $80,000 two weeks ago. Equities have also recovered from recent lows. The S&P 500 sits less than 1% below its highs, while the NASDAQ remains more than 2% off its peak.
Aggregated altcoin market caps are flat at $1.26T. Bitcoin dominance rose 0.1% this week after declining more than 1.3% from the recent high. In recent weeks, Bitcoin has been more volatile than altcoins.
Data Summary:
DVOL: 47.27%
Equal-weighted futures basis spread: 3.83% APR
Futures curve is in a steep contango
Perp funding rates remain near zero with occasional negative dips
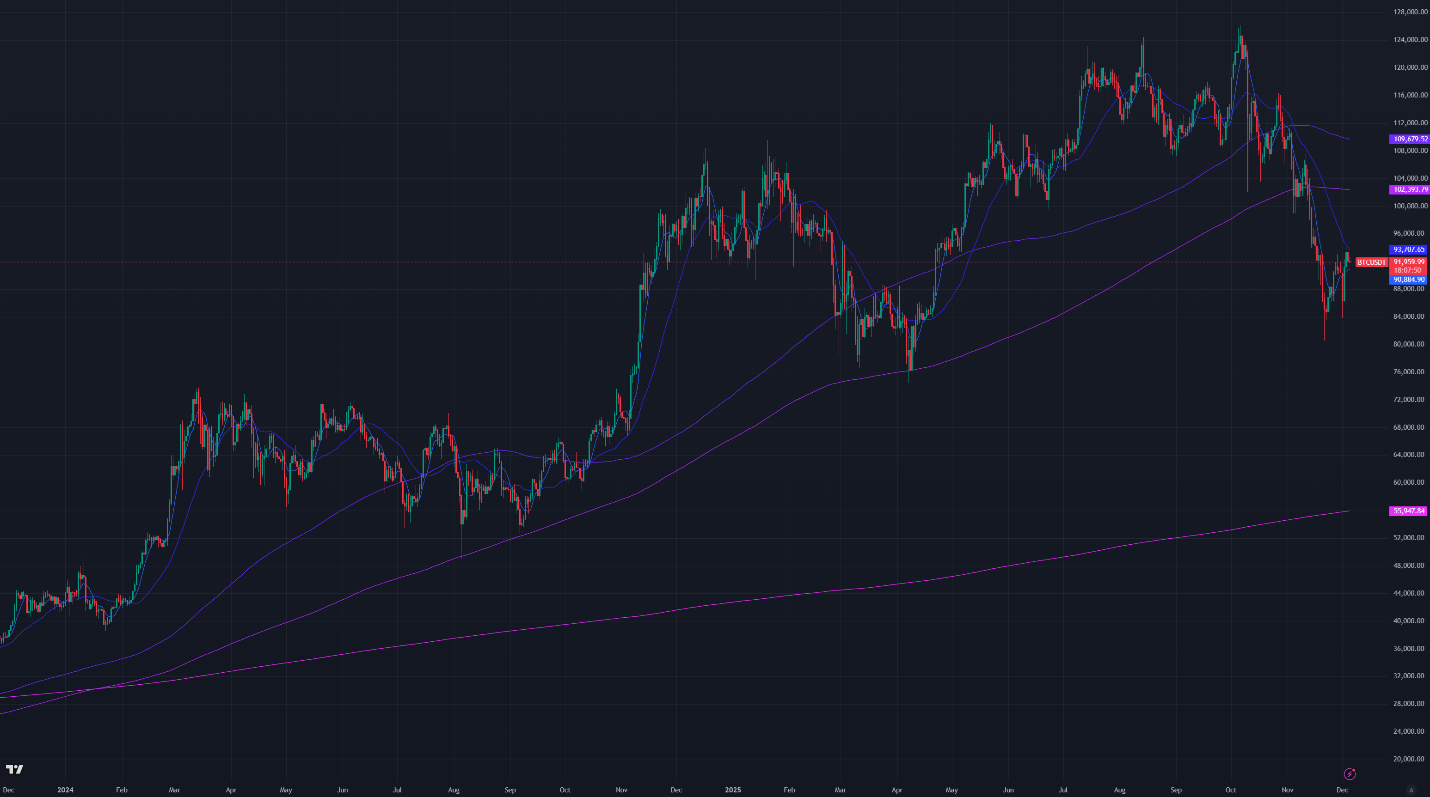
Figure 1: BTC Price, Daily Candles, & Moving Averages; 2 years; Source: Binance

Figure 2: Crypto Market Cap Excluding Bitcoin, Daily Candles, & Moving Averages; 2 years
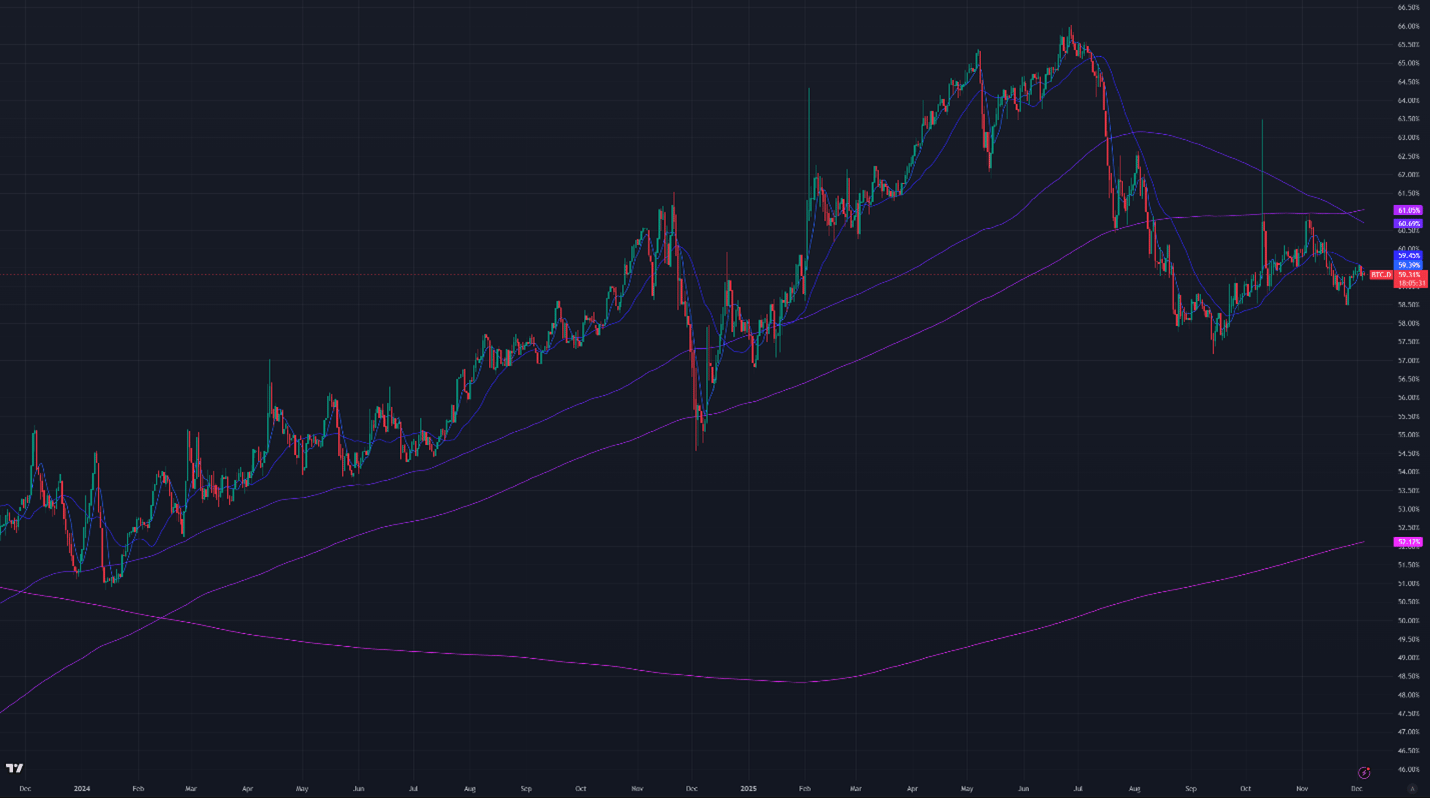
Figure 3: Bitcoin Dominance, Daily Candles, & Moving Averages; 2 years
The moving averages (MA) in Figure 1 are:
Current Price: $92,000
7-Day MA: $90,900
30-Day MA: $93,700
180-Day MA: $109,700
360-Day MA: $102,400
200-Week MA: $56,000
Bitcoin is trading below the 30-day moving average but remains above the 7-day MA. Price is still in a downtrend, though short-term averages have now caught up to price. Bitcoin has cleared most short- and medium-term MAs, leaving limited support until the 200-week MA near $55,000, which has historically marked cycle bottoms. The current price near $92,000 is a support area, with additional support below at $86,000, $80,000, $76,000, and $60,000.
Trend Following
Returns for the 7-day and 30-day Bitcoin trend-following portfolio are down 8.68% from January’s ATH, after a decrease 6.99% last week. The long trend portfolio is active nearly every day and has been impacted by intraday volatility. The dip below $90,000 on Monday and Tuesday forced a realized loss on the position.
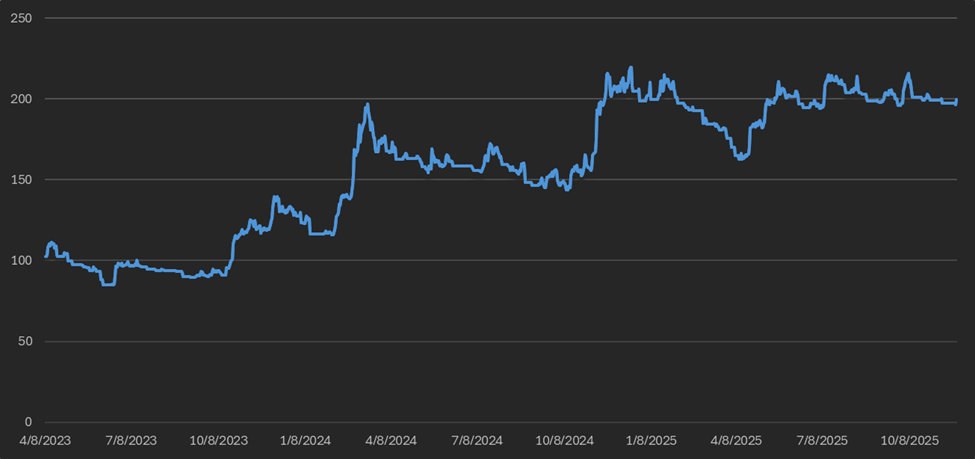
Figure 4: Bitcoin 7 & 30-day Trend Following Strategy Returns
BTC ETF Flows
Net outflows were $71M this week, a slowdown in the rate of outflows compared to Thanksgiving week.
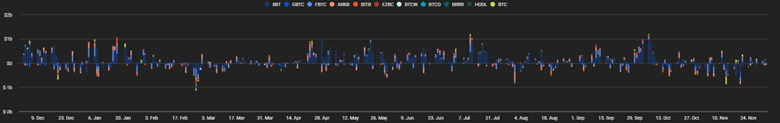
Figure 5: Bitcoin ETF Flows, Daily Bars; Source: The Block
Volatility
Bitcoin’s implied volatility (DVOL) contracted over the past week as prices rose. DVOL is at 47.27%, down from 49.77% last week, after spiking to nearly 55% on Monday when price moved below $90,000. Since the October crash, volatility has been mostly range-bound between the low 40% and low 50%. When Bitcoin traded below $90,000 the bounds often broke.
Implied volatility hit a two-year low in late September before the crash drained options liquidity and pushed vol into its current range. This deviation runs counter to the 18-month downtrend driven by market-maker hedging tied to Bitcoin products such as ETFs, miners, and treasury companies. Systematic hedging is a major factor in driving Bitcoin's implied volatility (IV) down. It can also influence prices to gravitate toward specific levels.
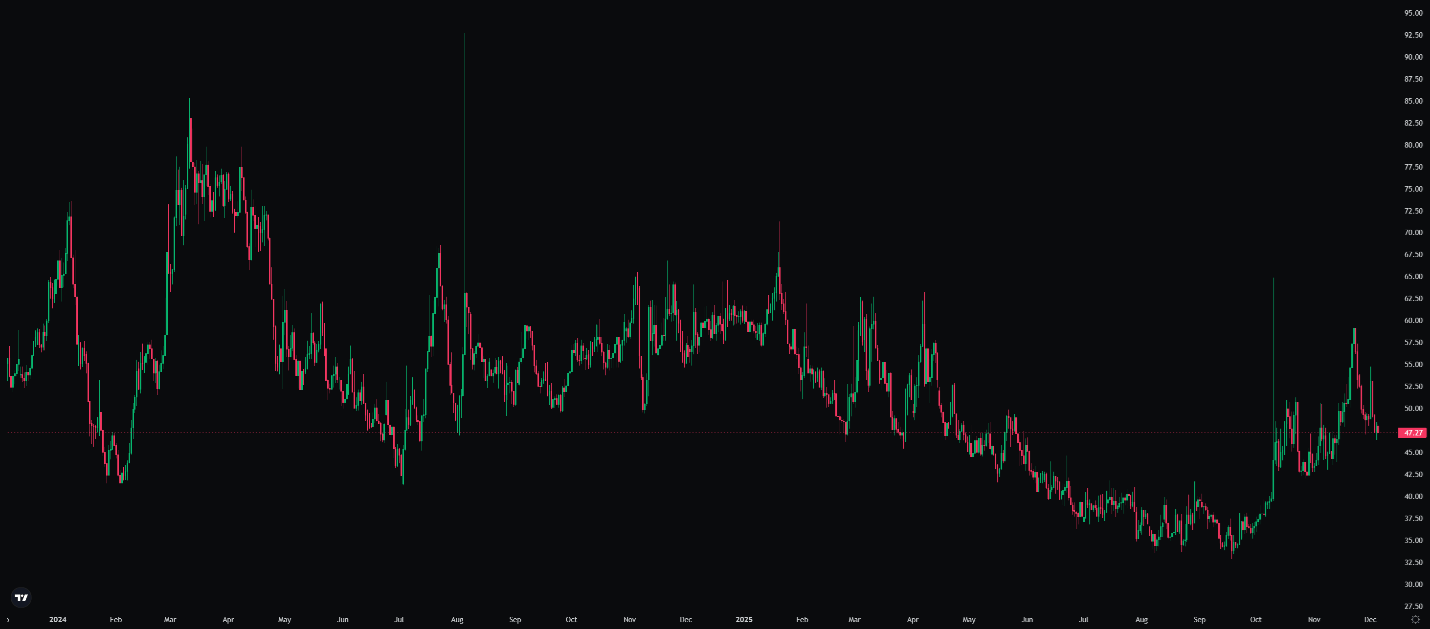
Figure 6: DVOL 2 Years; Bitcoin Index Price; Source: Deribit
Basis Spread
The basis spread, or the price of a futures contract over its spot price, is positive across all maturities. The average (equal weighted) basis spread fell from 5.1% APR to 3.83% APR week-over-week. If the front week contract is removed, then average rises to 4.44% which is below last week’s average APR.
The futures curve remains in normal contango, with the front month (December 26) trading below later maturities. The spread between the lowest and highest yielding contracts widened from 2.29% to 4.43%, driven by a sharp drop in the front-week contract and a 0.8% decline across the rest of the curve.
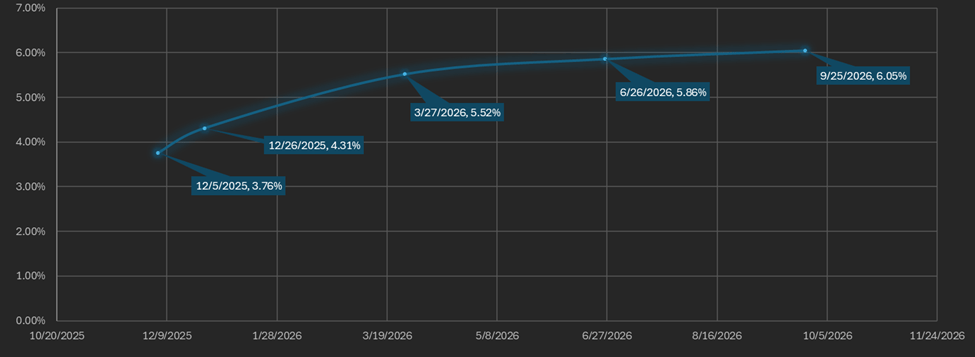
Figure 7: Futures Curve; Maturity Date, APR %
Macro
On October 30, the Federal Reserve held its seventh FOMC meeting of the year, where Chair Jerome Powell cut the federal funds rate by 25 bps to 3.75%–4% and ended the Fed’s quantitative tightening (QT) program.
Despite QT formally stopping on December 1, system liquidity has declined due to delayed government payments from the October shutdown and a rising Treasury General Account balance, which holds funds at the Fed rather than in the banking system.
The yen-dollar carry trade is another source of global liquidity pressure. A recent surge in Japanese government bond yields has made the trade less profitable. Should liquidity become overly restricted, traders will be compelled to unwind their positions, which could lead to a sharp spike in treasury bill yields.
Markets indicate investors are rotating back to risk assets after reducing exposure in recent weeks. The dollar index (DXY) now sits at 98.96. U.S. 30-year Treasury yields are increasing, with rising long-term inflation expectations as a possible driver.
The VIX is at 15.74% from 17.18% last week, while the interest rate-adjusted MOVE index (MOVE index/10 Year Treasury Bond Yield) fell from 18.01% last week to a multi-year low of 16.01%.

Figure 8: VIX, Daily Candles; 2 Years
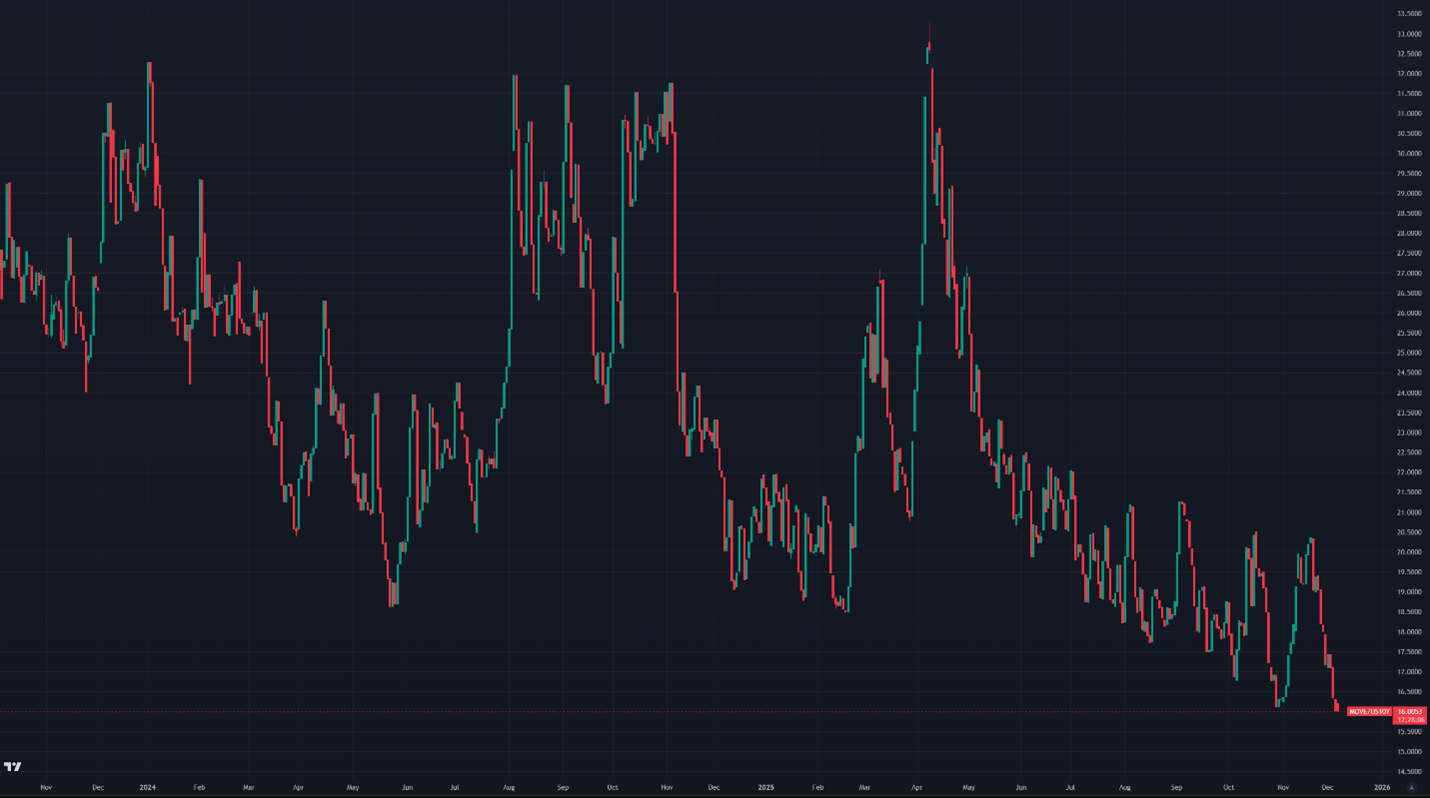
Figure 9: Move Index/US10Y, Daily Candles; 2 Years
Sincerely,
The Hermetica Team