- Hermetica
- Posts
- Weekly Update - August 8, 2025
Weekly Update - August 8, 2025
Connect with OKX & Phantom

IN THIS ISSUE
🔌 Connect with OKX & Phantom
💰 USDh Yield Recap
☎️ Hermetica Hangout: Community Call
📈 Weekly Market Review
Like what you see? Follow us on X so you don’t miss any future announcements:
Connect with OKX & Phantom

Swap USDC from Ethereum directly into USDh using either wallet.
It’s easier than ever to rotate from Ethereum to the Bitcoin-backed, yield-bearing stablecoin.
Swap now.
USDh Yield Recap

USDh met with stakers daily for the past 32 weeks, handing out attendance bonuses.
If you plugged in this week, you earned 8% APY.
Hermetica Hangout: Community Call

This week, we hosted a community call to share the latest on USDh. If you missed the session, catch the recording here.
Next week, we'll showcase another team expanding the frontiers of BTCfi. Set a reminder, you wouldn’t want to miss it.
Market Review
Bitcoin holds near $116,000 while altcoins surge. Crypto treasury company Sharplink may have contributed to the increase with its $200M raise on Thursday to buy ETH. The firm has accumulated $1.9 billion in ETH.
• DVOL hit another two-year low
• Average equal-weighted futures basis spread is up 1.86% APR to 8.21% APR
• The futures curve rose and flattened
• Perps funding rates mostly positive, peaking at 30% APR on Friday
Altcoin market caps jumped from $1.41T to $1.5T. Bitcoin dominance fell 1.2% and now sits just below the 200-week MA.

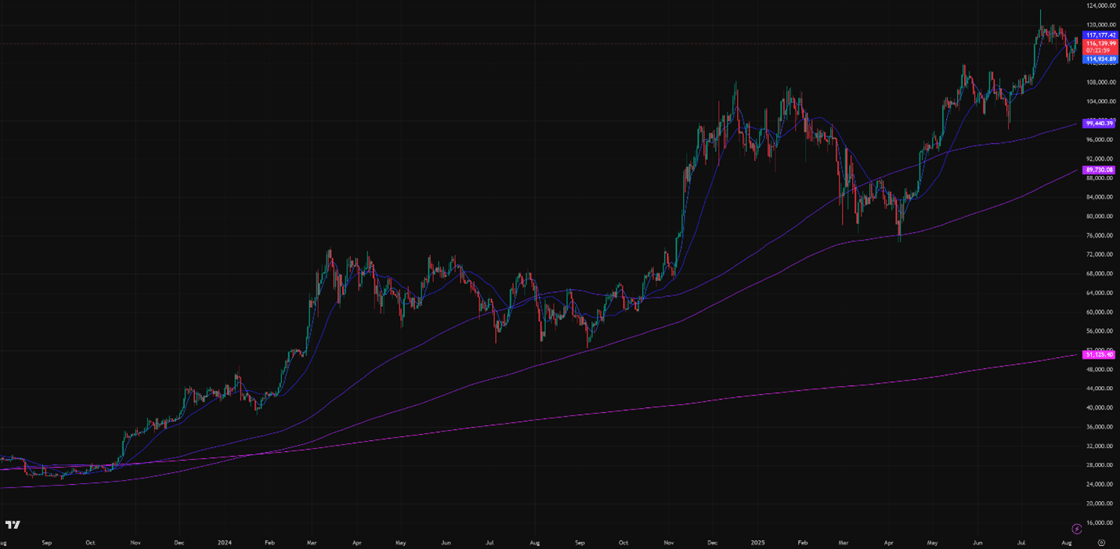
Figure 1: BTC Price, Daily Candles, & Moving Averages; 2 years; Source: Binance

Figure 2: Crypto Market Cap Excluding Bitcoin, Daily Candles, & Moving Averages; 2 years

Figure 3: Bitcoin Dominance, Daily Candles, & Moving Averages; 2 years
The moving averages (MA) in Figure 1 are:
• Current Price: $116,100
• 7-Day MA: $114,900
• 30-Day MA: $117,200
• 180-Day MA: $99,400
• 360-Day MA: $89,700
• 200-Week MA: $51,100
Bitcoin sits above the 7-day MA but below the 30-day MA after rejecting the latter on Friday. Bitcoin’s uptrend isn’t fully reestablished.
Trend Following
Returns for a Bitcoin 7-day and 30-day long trend-following portfolio are down just 0.38% from January’s ATH. Three months ago, they were down 22.99%, the largest drawdown since late 2024. Trend strategies are struggling due to the price being range-bound between $115,000 and $120,000.

Figure 4: Bitcoin 7 & 30-day Trend Following Strategy Returns
BTC ETF Flows
Net outflows totaled $963M this week, down $1.3B from last week’s $300 million in positive inflows. Demand fell for both Bitcoin and Ethereum ETFs, with ETH ETF net outflows at $287M.

Figure 5: Bitcoin ETF Flows, Daily Bars; Source: The Block
Volatility
Bitcoin’s implied volatility (DVOL) hit 34.35% Friday morning, its lowest since September 2023. Low DVOL may reflect weak demand or that market makers are already hedged.
TradFi companies selling calls on BTC ETFs and Bitcoin-linked stocks put systematic downward pressure on options prices and volatility.

Figure 6: DVOL 2 Years; Bitcoin Index Price; Source: Deribit
Basis Spread
The basis spread is positive across all maturities, with the average (equal-weighted) spread rising 1.86% APR from 6.35% to 8.21% APR.
The futures curve sits in a flat, distorted contango, with front weeks trading above later maturities. The 1.27% gap between the lowest and highest yielding contract marks the flattest curve since July 11th.
TradFi call selling indirectly suppresses Deribit’s Bitcoin futures curve by reducing market maker demand for delta hedges. Futures volume remains about 33% below January levels despite higher spot prices.

Figure 7: Futures Curve; Maturity Date, APR %
Macro
The Fed is holding rates and liquidity steady while President Trump pushes for further international trade deals.
At the July 30th FOMC meeting, Fed Chair Powell left rates and QT unchanged at $5B/month, noting inflation uncertainty. Trade deals have not yet influenced Fed policy. December SOFR futures now price in just a 25-basis point (bp) cut by year-end.
The European Central Bank (ECB) cut rates by 25 bps on June 6th; the ECB has not cut since, despite more clarity on its trade deal with America. The Swiss National Bank cut rates by 25 bps to 0% in June, but the Bank of England (BOE) and People’s Bank of China (PBOC) did not. No major central bank has moved since June.
Bitcoin’s long-term uptrend remains correlated to the M2 money supply(Figure 8), but it cannot be used as a precise timing tool.

Figure 8: M2 Money Supply (Blue), BTC price (Red); 5 years; Source Federal Reserve & Binance
M2 money supply includes physical currency, checking and savings deposits, time deposits, and money market funds. It expands through private sector lending or Fed quantitative easing. Since 2022, the Fed’s quantitative tightening has reduced M2, so recent growth likely comes from higher private leverage, a risk if borrowers can’t service debt. In 2022, Bitcoin’s second peak came six months before the M2 top.
The Dollar Index ($DXY) closed at 98.16 on Friday, near 3-year lows. 30-year Treasury yields, which hit 5.15% on May 22nd, are now 4.85% and still near multi-year highs. Q2 and early Q3 saw weak $DXY with high yields, which signaled foreign diversification away from US markets. Lately, the trend is reversing.
Historically, $DXY and long-term yields move in strong positive correlation. Figure 9 demonstrates the strong correlation between the relative value of the dollar (DXY) and U.S. Treasury bond yields.

Figure 9: DXY Index returns (Purple), 30-year T-Bond yield returns (Blue), and 10-year T-Bond yield returns (Red), 3 years
Both equity market implied volatility (VIX) and US Treasury bond implied volatility (MOVE) are near their long-term steady state. The VIX is currently 15.41, down marginally from 16.71 the previous Thursday, while the MOVE index is currently 80.15, up marginally from 79.84.

Figure 10: VIX, Daily Candles; 2 Years]

Figure 11: Move Index, Daily Candles; 2 Years
Sincerely,
The Hermetica Team