- Hermetica
- Posts
- Weekly Update - August 1, 2025

IN THIS ISSUE
🪙 USDh Secure by Design
📰 Custodian Attestations: July 2025
🗳️ SIP-031 Hard Fork is Live
💰 USDh Yield Recap
☎️ Hermetica Hangout: Granite
📈 Weekly Market Review
Like what you see? Follow us on X so you don’t miss any future announcements:
USDh Secure by Design

This week, we published an article explaining how our Reserve Fund keeps USDh stable.
If BTC perp funding turns negative, the Reserve Fund covers funding payments for our short position.
A layer of protection that ensures our delta-neutral position holds at all times. Read the full article for more details on how USDh’s architecture absorbs volatility.
Custodian Attestations: July 2025

The July 2025 attestation for USDh is live.
We’re sharing the latest attestation from our custodians, verifying that every asset backing USDh is securely held off-exchange in institutional-grade custody.
In summary, as of the snapshot time:
USDh supply: $5,698,484.43
Copper custodied assets: $3,355,111.07
Ceffu custodied assets: $1,981,500.00
Redeeming Reserve Stacks: $356,258.63
Redeeming Reserve Ethereum: $7,981.17
Total backing assets: $5,702,417.49
Reserve Fund: $68,105.23
∘ USDC: $60,149.59
∘ USDh: $7,955.64
Total % of USDh: 101.12%
SIP-031 Hard Fork is Live

Stacks’ SIP-031 hard fork was successfully activated.
The activation sets a new emissions schedule and Treasury structure in motion. Stacks is now equipped to fund builders, expand liquidity, and strengthen the network.
See what comes next for SIP-031 and how the Treasury will be deployed.
USDh Yield Recap

USDh showed up every day this week and clocked in with yields.
This week, it punched the timecard with 16% APY. Your wallet’s hardest worker, hands down.
Hermetica Hangout: Zest

This week, we hosted Granite for a discussion on how USDh plugs into the lending market and powers liquidations. If you missed the session, catch the recording here.
Next week, we’ll keep the momentum going with another session highlighting builders shaping the future of BTCfi. Mark your calendar and join the conversation.
Market Review
Bitcoin fell to its previous ATH breakout level of $114,000 this week. Altcoins remain relatively strong, but are beginning to lose ground.
• DVOL broke its short-term uptrend, hitting new 2-year lows
• The average equal-weighted futures basis spread fell 2.04% APR to 6.35% APR
• The entire futures curve declined this week
• The front-end of the curve remains in an upward-sloping contango
• Perpetual futures funding rates stayed positive but trended lower, peaking Sunday at 35% APR and ending near zero
Aggregated altcoin market caps fell slightly from $1.47T to $1.41T week-over-week. Bitcoin dominance rose 0.55% and rebounded off the 365-day MA earlier in the week.

Figure 1: BTC Price, Daily Candles, & Moving Averages; 2 years; Source: Binance

Figure 2: Crypto Market Cap Excluding Bitcoin, Daily Candles, & Moving Averages; 2 years

Figure 3: Bitcoin Dominance, Daily Candles, & Moving Averages; 2 years
The moving averages (MA) in Figure 1 are:
Current Price: $114,800
7-Day MA: $117,400
30-Day MA: $115,900
180-Day MA: $98,800
360-Day MA: $89,100
200-Week MA: $50,800
Bitcoin is now below both the 7-day and 30-day MAs, ending its short-term uptrend. Altcoins have outperformed in recent weeks, pushing BTC dominance to test its 1-year MA twice.
Trend Following
Returns for the Bitcoin 7-day and 30-day long trend following portfolio are down 0.38% from January’s ATH. Three months ago, the portfolio was down 22.99%, the largest drawdown since late 2024 when it fell nearly 25%. With BTC now trading below most short-term MAs, trend strategies have started to exit positions.

Figure 4: Bitcoin 7 & 30-day Trend Following Strategy Returns
BTC ETF Flows
Net outflows this week were $302M. Weekly net flows were flat at around $300M, down sharply from $3.05B the week of July 14th. Ethereum ETFs saw $759 million in inflows, over twice that of Bitcoin.
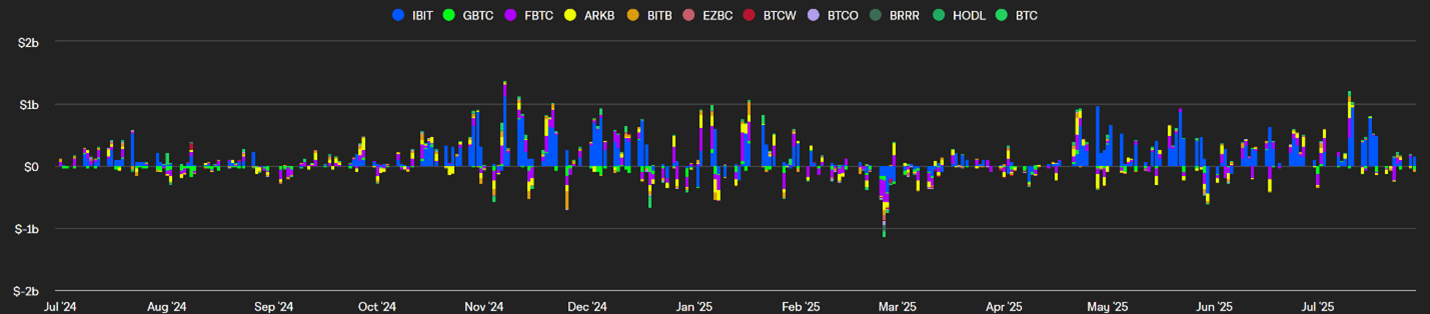
Figure 5: Bitcoin ETF Flows, Daily Bars; Source: The Block
Volatility
Bitcoin’s implied volatility (DVOL) is 37.18%. DVOL reached a low of 34.7% on Thursday, its lowest since September 2023.
TradFi Bitcoin products, including BTC ETFs and Bitcoin-linked companies, are increasingly using call-selling strategies to generate yield. This systematic call selling is pressuring options prices and implied volatility lower. For example, the Yield Max ETF $MSTY sells $4.5Bin notional calls on Strategy (formerly MicroStrategy) stock on a monthly and quarterly basis. Hedge funds are executing similar trades on Bitcoin miners and ETFs. These calls are sold to market makers, who then hedge by selling similar calls on Deribit, capping DVOL even as rising prices may normally push it higher.

Figure 6: DVOL 2 Years; Bitcoin Index Price; Source: Deribit
Basis Spread
The basis spread, or the price of a futures contract over its spot price, remains positive across all maturities. The average (equal-weighted) basis spread fell sharply this week, dropping 2.04% APR from 8.39% to 6.35%.
The futures curve is in a mostly normal contango, with the back-week contract (August 15th) at the lowest APR of 5.01%, rising steadily through the June 2026 contract at 7.33%. The spread between the lowest and highest yielding maturities is 2.31%.

Figure 7: Futures Curve; Maturity Date, APR %
Macro
The U.S. House passed the Digital Asset Market Clarity Act (DAMC) and the GENIUS Act on the week of July18th, establishing regulations for the crypto industry and stablecoin providers. These measures establish guardrails and open the door for greater participation by institutional investors.
On July 30th, the Federal Reserve held its fifth FOMC meeting of the year. Powell did not cut rates or reduce quantitative tightening (QT) from the $5B level set in March. The European Central Bank (ECB) last cut rates by 25 bps on June 6th. The Swiss National Bank cut rates to 0% in June, while the Bank of England (BOE) and People’s Bank of China (PBOC) left rates unchanged. No major central bank has adjusted policy since June.
The often-cited Bitcoin–M2 money supply correlation (Figure 8) can be attributed to Bitcoin’s long-term uptrend since 2023, though it does not provide precise timing for when trends start or end.

Figure 8: M2 Money Supply (Blue), BTC price (Red); 5 years; Source Federal Reserve & Binance
The Dollar Index ($DXY), which measures the dollar against a basket of currencies, rose to 99.17 as of Thursday evening, 2.88% above three-year lows set at the start of the month. The index briefly climbed above 100 after the U.S. announced the EU trade deal, but it has since retreated.
Thirty-year treasury yields reached 5.15% on May 22nd, the highest level since the end of the 2023 rate hike cycle. They now sit at 4.81%, still near multi-year highs. Historically, $DXY and US treasury yields show a strong positive correlation, as illustrated in Figure 9.

Figure 9: DXY Index returns (Purple), 30-year T-Bond yield returns (Blue), and 10-year T-Bond yield returns (Red), 3 years
Both equity market implied volatility (VIX) and US Treasury bond implied volatility (MOVE) remain near their long-term averages. The Middle East conflict had only a mild impact on equity IV, and volatility fell to new lows once tensions cooled. The VIX is 16.71, slightly higher than 15.26 last Thursday, while the MOVE index is 79.84, down slightly from 82.75.

Figure 10: VIX, Daily Candles; 2 Years

Figure 11: Move Index, Daily Candles; 2 Years
Sincerely,
The Hermetica Team